I write about swing trading, chart structure, risk & discipline. Full-time trader. 10M+ views on X teaching markets v...
Jul 9 • 11 tweets • 3 min read
I paid around 6,000 dollars a year to study under one of the best traders alive.
Most people expect a room full of secret setups.
That is not what changed my trading.
It was something far more boring, and far more important ↓
Jul 8 • 11 tweets • 3 min read
My favorite swing trading framework.
Five steps.
I run the same five on every single trade.
No improvising, no reinventing it each week.
Here is how each step works ↓
Jul 8 • 12 tweets • 3 min read
In 1983 a trader handed his own money to 23 complete beginners.
A security guard. A teacher. A musician.
Four years later they had made hundreds of millions of dollars.
He proved something about trading that still stings today.
Here is the story ↓
Jul 8 • 11 tweets • 3 min read
The KING of the charts this year was not a trader.
It was a stock.
Cupid Limited quietly ran over 1,300 percent.
So I studied every candle to see how the move actually built.
Here is the framework the chart followed ↓
Jul 7 • 9 tweets • 2 min read
Most people think reading a chart takes 10,000 hours.
I can explain the part that matters in 2 Mintues.
Whether big money is actually buying comes down to three things.
Let us dive in ↓
Jul 7 • 12 tweets • 3 min read
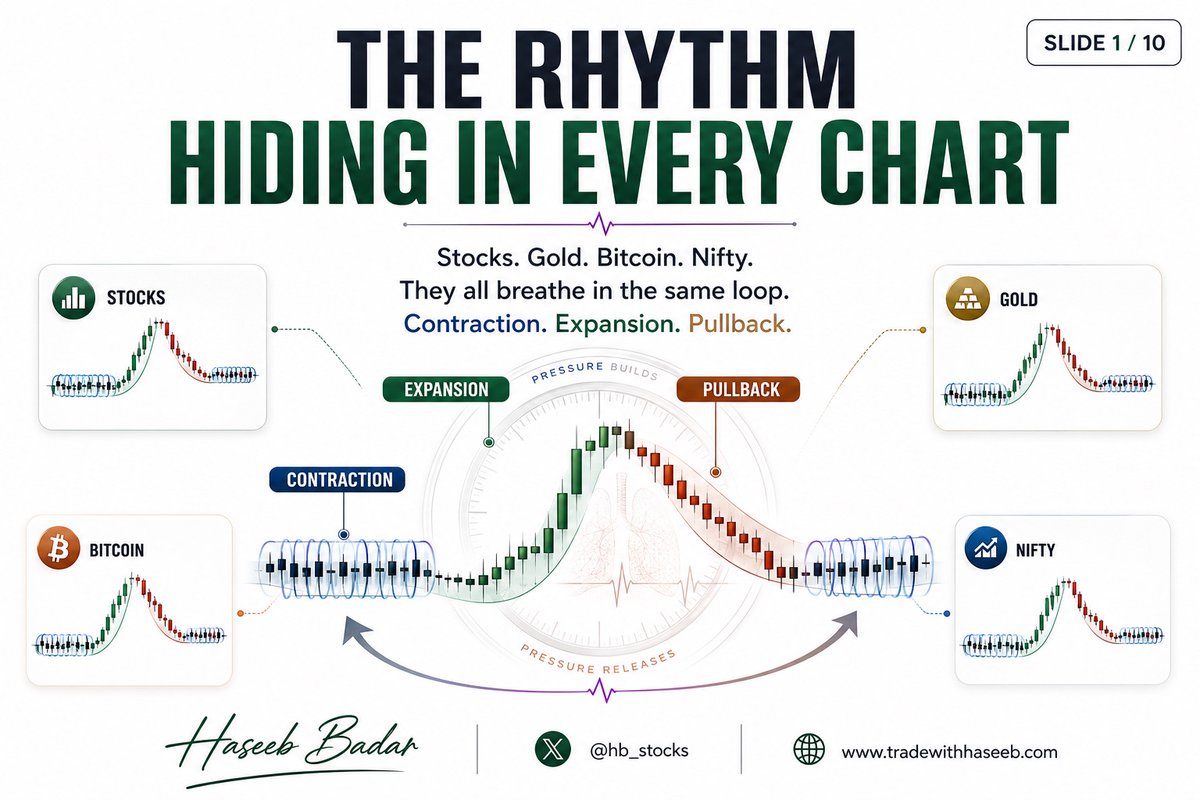
Every chart in the world moves in one rhythm.
Stocks, gold, Bitcoin, Nifty.
Learn it once and you never unsee it.
Here is the rhythm hiding in every chart you have ever traded ↓
Jul 6 • 7 tweets • 4 min read
Top 5 indicators on TradingView.
These will 5x your trading 📈
(Links included)
A thread 🧵
Indicator: RVOL
It compares current volume with the stock’s average volume over a selected period.
It helps you identify whether a move has real participation behind it.
A breakout with price up but low RVOL may be weak.
A breakout with price up and RVOL 10-20% in first 3-5 mins means institutions / serious buyers may be active. tradingview.com/script/UyzdpoX…
Jun 30 • 12 tweets • 3 min read
There's one setup so reliable it quietly minted a generation of millionaire traders.
3 to 5 days. That's how long the real move usually takes.
Miss the start and you miss almost all of it.
Here's exactly what it looks like 👇
Jun 25 • 11 tweets • 3 min read
This is Pradeep Bonde.
For nearly 20 years he's quietly run one of the most respected trading blogs online, under the name Stockbee.
No tips. No hype. No tall claims.
More than one of today's most famous momentum traders traces their foundation back to him.
Here's his philosophy 🧵
Jun 22 • 12 tweets • 3 min read
I paid $6,000 a year
for Mark Minervini's Private Access.
He's won the US Investing Championship twice.
Here are 9 rules from inside
that changed how I trade 👇
(Save this one.)
Jun 17 • 12 tweets • 4 min read
I paid for Oliver Kell's masterclass to find his real edge.
He's the 2020 US Investing Champion who returned 941% in a single year.
I expected complex systems.
I got 6 plain scans I now run daily.
Here's what they quietly screen for 👇
Jun 16 • 11 tweets • 3 min read
O'Neil. Minervini. Zanger. Qullamaggie.
Different eras. One identical morning habit.
Every day, they took apart the stocks
that were already winning.
Here's exactly how to do it 👇
(Save this one.)
Jun 16 • 10 tweets • 3 min read
I paid for Manas Arora's 1-on-1 mentorship
so you don't have to.
Here are the 8 ideas
that quietly rebuilt my trading ↓
Jun 12 • 11 tweets • 3 min read
David Ryan won America's biggest trading championship three years in a row.
Not once. Three times, back to back.
He had no secret indicator and no special gift.
He learned a handful of rules from his mentor and refused to break them.
Here are the rules 👇
Jun 9 • 11 tweets • 3 min read
A hundred years ago, Richard Wyckoff cracked how the market's biggest operators secretly move a stock.
The method still works — and it's hiding on every chart you open.
It shows when smart money is loading up, and when they're quietly dumping on the crowd.
Here's how to read it 👇
Jun 8 • 10 tweets • 3 min read
Before a stock goes on a massive run, institutions spend months quietly loading up.
They try to hide it.
But they always leave the same 5 fingerprints behind — right there in the base everyone else finds boring.
Here's how to read them ↓
Jun 8 • 11 tweets • 3 min read
I don't understand why more traders don't use ChatGPT every day.
Not for buy/sell calls — it's useless at those.
For learning the game faster than any course can teach you.
Here are 10 prompts to start ↓
ChatGPT can't see your chart. It doesn't know today's price. It has a knowledge cutoff, and when it doesn't know something, it makes up numbers — confidently.
It is not a stock picker. It never was.
Which is why most "trading prompts" you see are useless.
"Analyze this stock's RSI and tell me to buy or sell."
You're asking a text predictor to read a chart it can't see and make a call it has no business making.
That's not an edge. That's borrowed confidence.
Jun 7 • 11 tweets • 3 min read
Price lies to you. Volume only tells half the truth.
But there's a third number that quietly reveals when big money is loading a stock — days before it breaks out.
It's free. Most traders have never heard of it.
Here's how to read smart money's footprints ↓
Jun 6 • 10 tweets • 3 min read
Manas Arora is overrated.
His strategies don't work.
Is what his jealous haters say.
But I took his 1-On-1 Mentorship and it transformed my trading.
Here are 8 powerful ideas I learned that you won't find anywhere else on X👇
Jun 1 • 9 tweets • 3 min read
He turned $10,775 into $42 million in 23 months.
No fund. No options. No fancy algorithm.
A pool builder from California did it with chart patterns and volume. Nothing else.
This is the Dan Zanger story, and the way he traded is simpler than you think.
May 30 • 9 tweets • 6 min read
I've tested hundreds of TradingView indicators over the years.
Most are noise. A handful genuinely changed how I read a chart.
Here are 7 tools — for both Cash and F&O — that can seriously level up your trading.
Save this thread. You'll keep coming back to it 🧵
One of the most important fundamental tools you can add to your charts. It overlays quarterly earnings data directly onto price — so you can instantly see whether a move is backed by real earnings growth or just hype.
Built by @finallynitin & @EquityCraze. (Paid — available on request.)
🔗