
Philanthropist. Finance, economics, public policy, neuroscience, genomics, and a 6-string. Realistic optimist often mistaken for prophet of doom.
 2/ If one’s goal is to detect waste, fraud, and abuse, your first act in office would not be to expel the independent Inspectors General, who serve as watchdogs against waste, fraud, and abuse. Their latest report includes thousands of investigations and successful prosecutions.
 @Acyn 2/ Very large case-control studies and meta-analyses involving millions, both in the U.S. and abroad show no association between vaccines and autism. The belief to the contrary traces to a small 1990's study that was falsified and later retracted.
 2/ Even taking record earnings and year-ahead earnings estimates at face value, using operating earnings that exclude extraordinary items, the S&P 500 price/forward operating earnings of 22 is at levels only seen at the 2000 and 2022 market peaks.
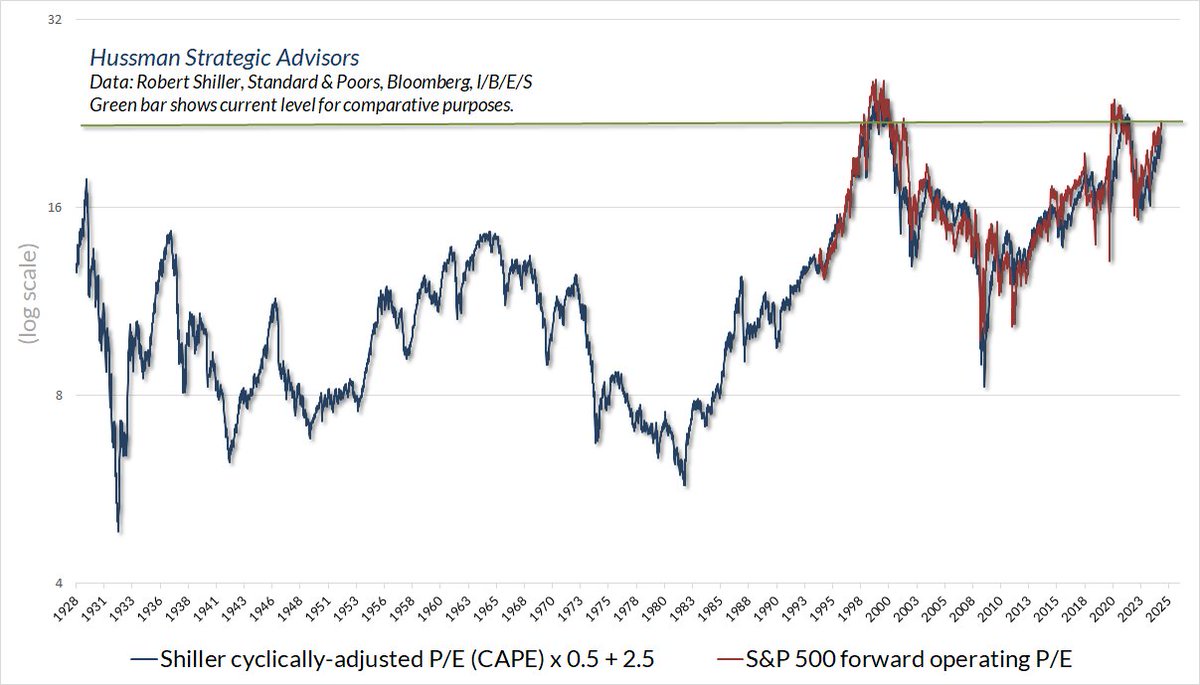
 2/ Consider the largest three tech stocks in 1999: Microsoft, Cisco, and Intel. Their total returns, respectively, since 2000 have averaged 10.38%, 1.88%, and -0.11%. Average 4.05%.

 On average, how much does the core PCE inflation rate fall during the 12-18 month period following the start of a recession?
 Market internals remain unfavorable and are deteriorating quickly, so there's an open trap door, but even internals don't label extremes.
 2/ QE didn't encourage greater lending by banks. Bank lending since 2008 has grown at just 3.4% - slowest growth rate in U.S. history.
 7/18/23: One of the many "compression/extension" syndromes I monitor - it's unusual to get this level of extension while our primary gauge of market internals holds unfavorable (as it is now).
 2/ The chart below shows the relationship between our most reliable valuation measure and actual subsequent market returns, in data since 1928
 Under the “depositor preference” provision of Title 12, Section 1821(11)(A) of U.S. banking law, depositors receive preference over any other general or unsecured senior liability of the bank.
  Meanwhile, as everyone looks to the Fed to defend banks from balance sheet losses, one might consider that the @FederalReserve is in the same situation. It just doesn't mark-to-market. It will recover its losses by retaining interest rather than returning it for public benefit.
 2/ Our most reliable gauge of market internals remains unfavorable. This can change, and we'll respond accordingly.
 Quick note on the distinction between responding to observables and relying on near-term forecasts and scenarios.
 ... preloading
 For more on the interaction between monetary policy and investor psychology, see the section titled “The two forms of quantitative easing”
 2/4 In addition to pandemic-related subsidies, understand just how much the record level of profits in recent years has benefited from depressed unit labor costs, which surged in the first quarter (chart through Q4 2021) and still comprise the majority of corporate expenses.
 Preloading - "what alternative is there?"
 As for interest rates, it's true that low interest rates can encourage higher valuations. But investors should realize that once those higher valuations are established, low interest rates do nothing to mitigate the poor long-term market returns that follow.