
From economy to culture: everything has a Matrix. A space to decode & visualise stories from across the planet.

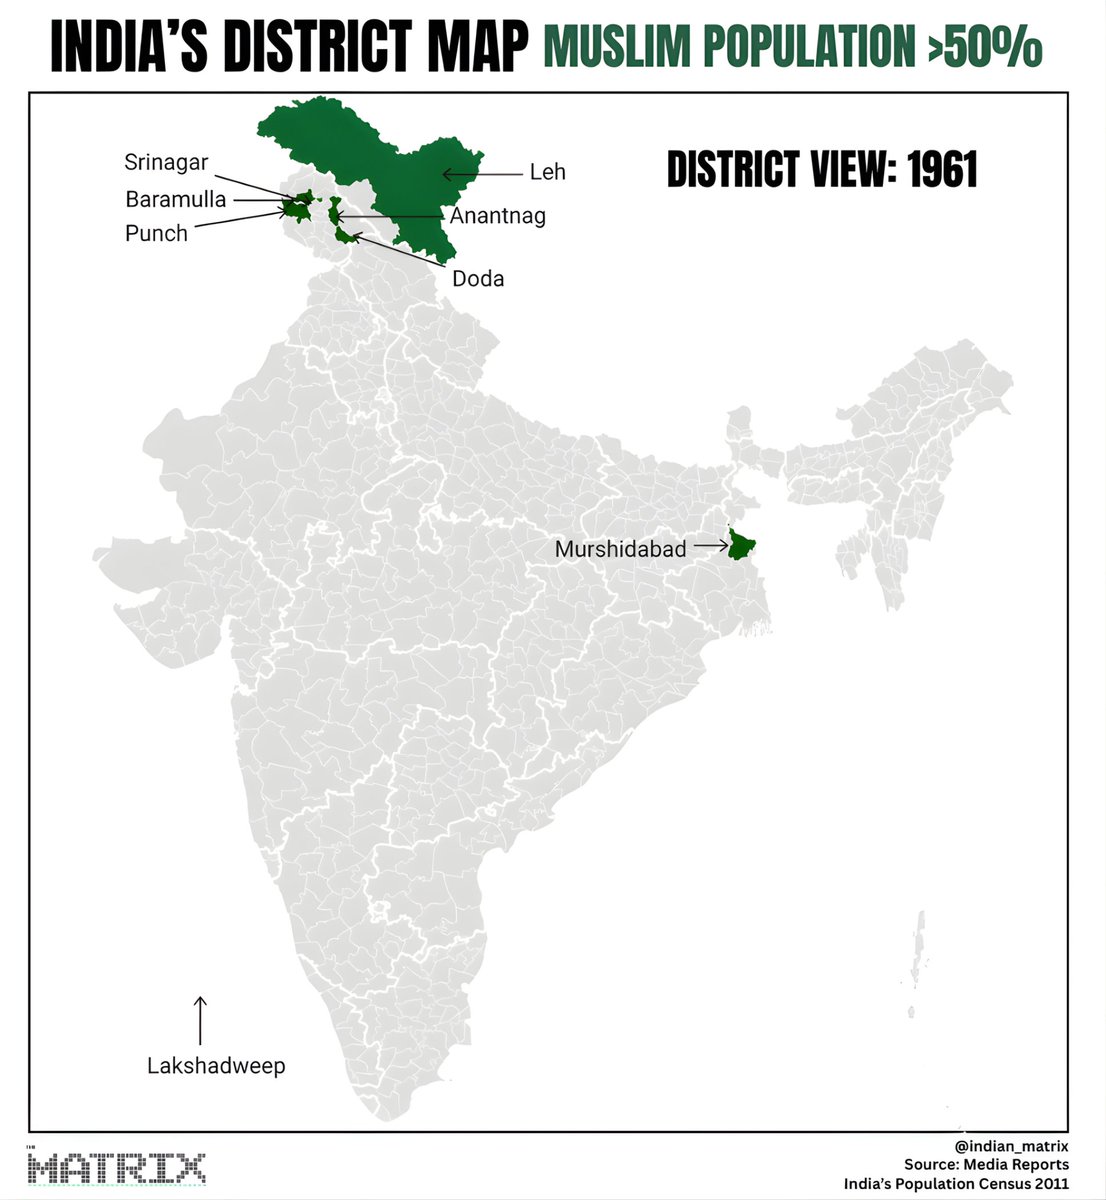
 1951 & 1961 - 8 Muslim-majority districts
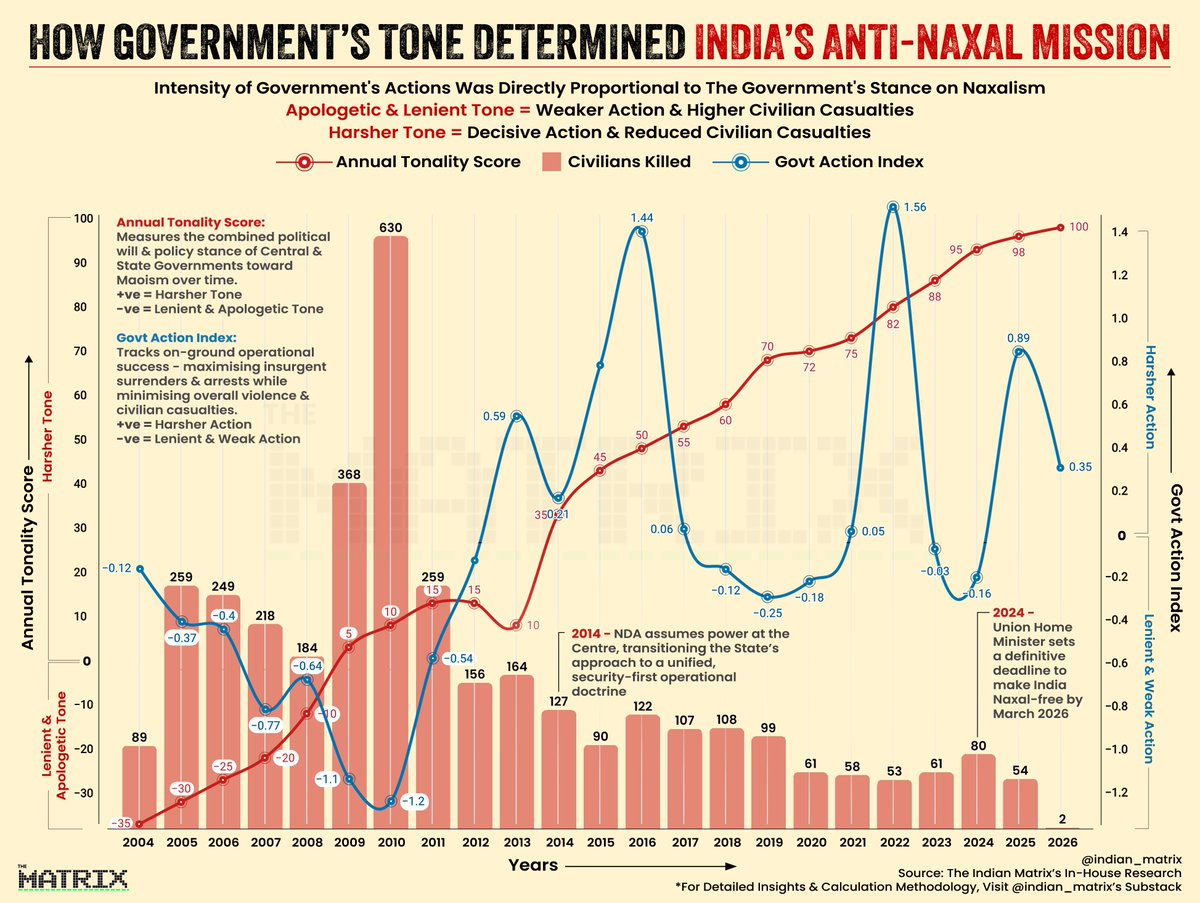 Quantifying Political Will (The Tonality Score)
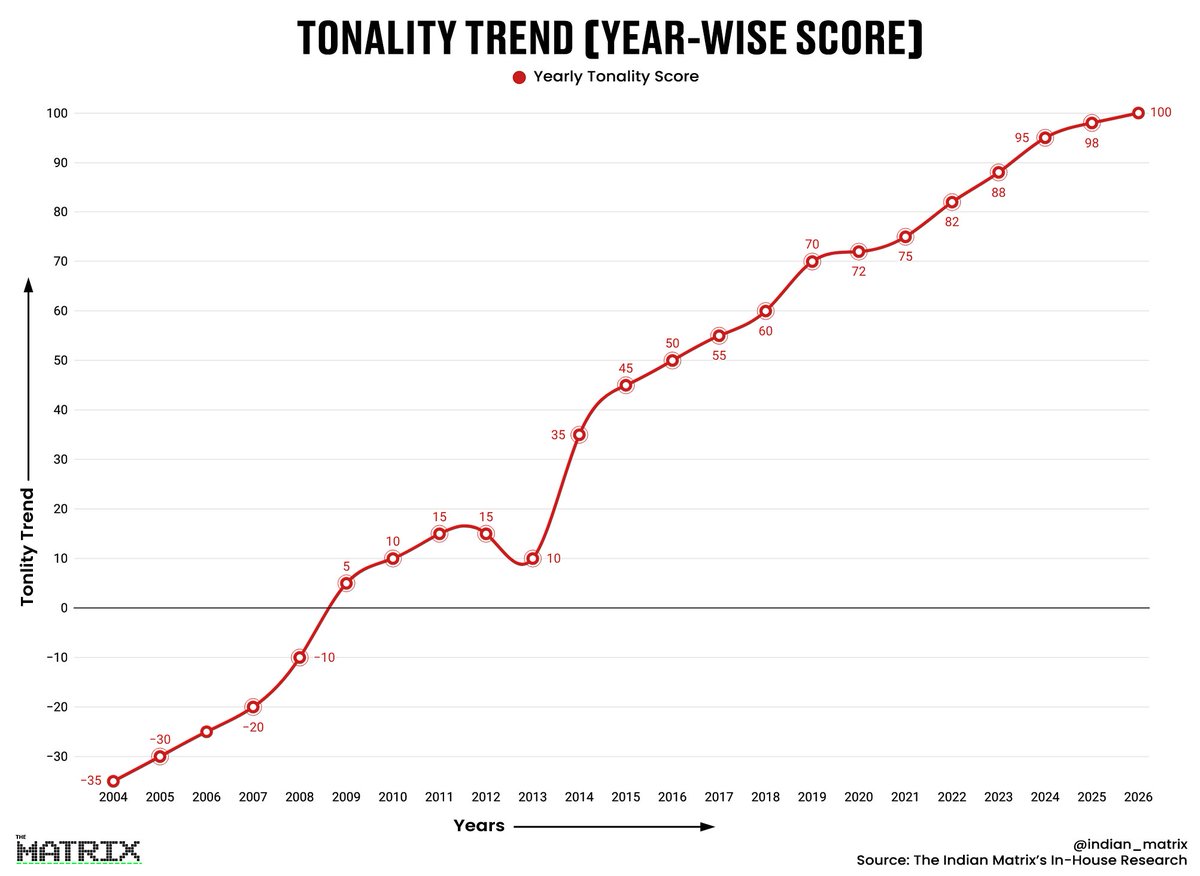
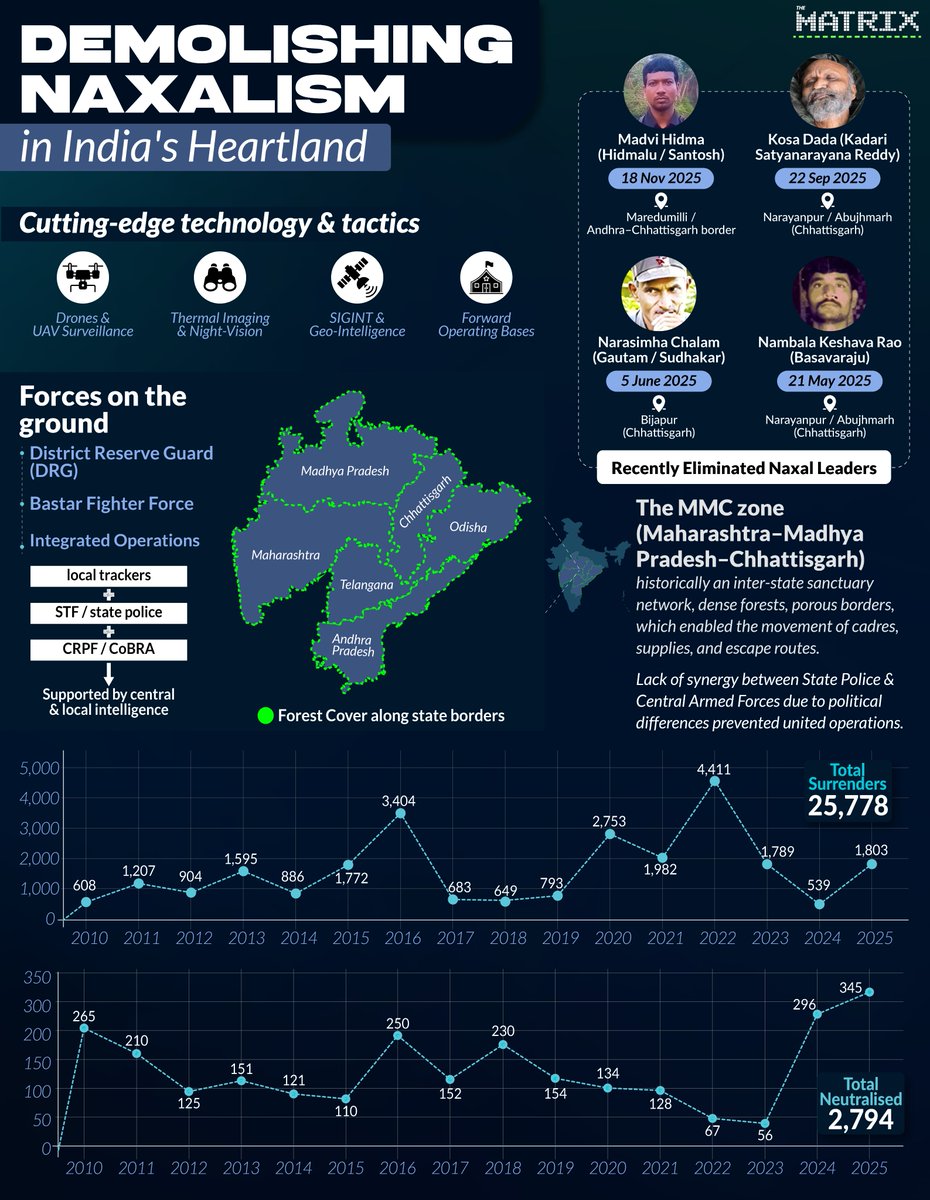
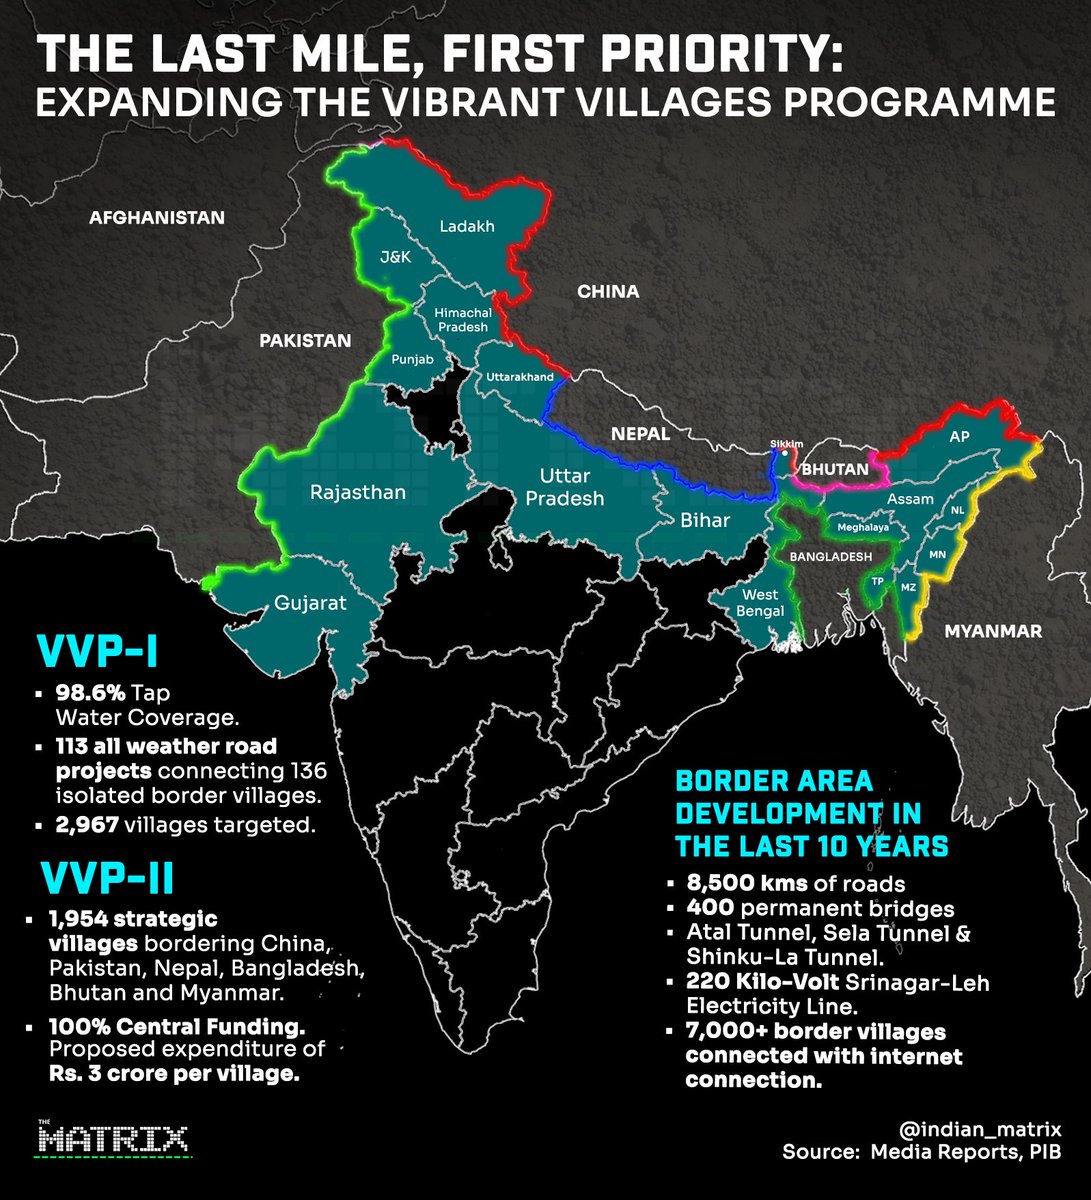 Phase-I began with a focus on the northern frontiers (China border).
 Letters Attributed to Tipu (1788–1790)
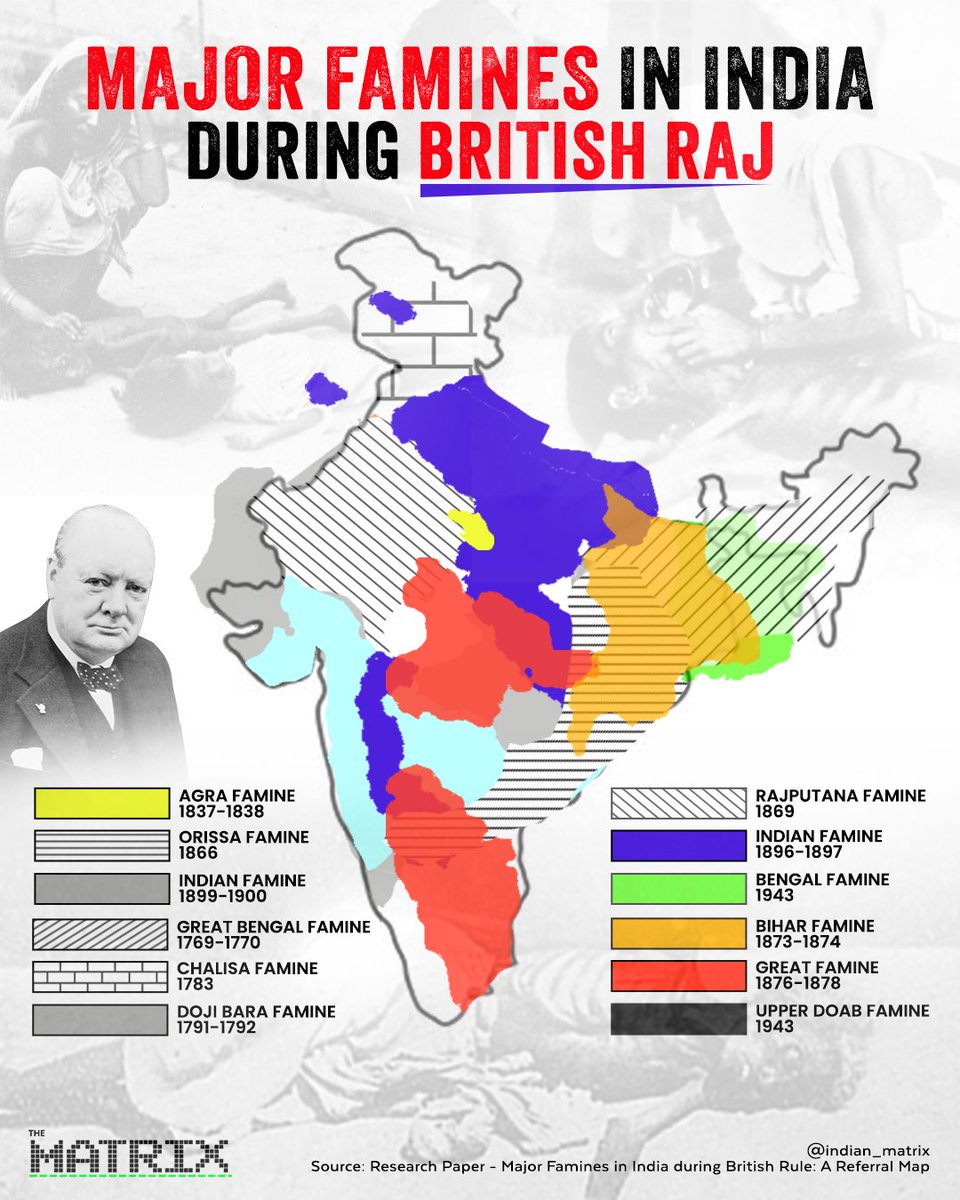 The Early Holocaust (1770–1792)
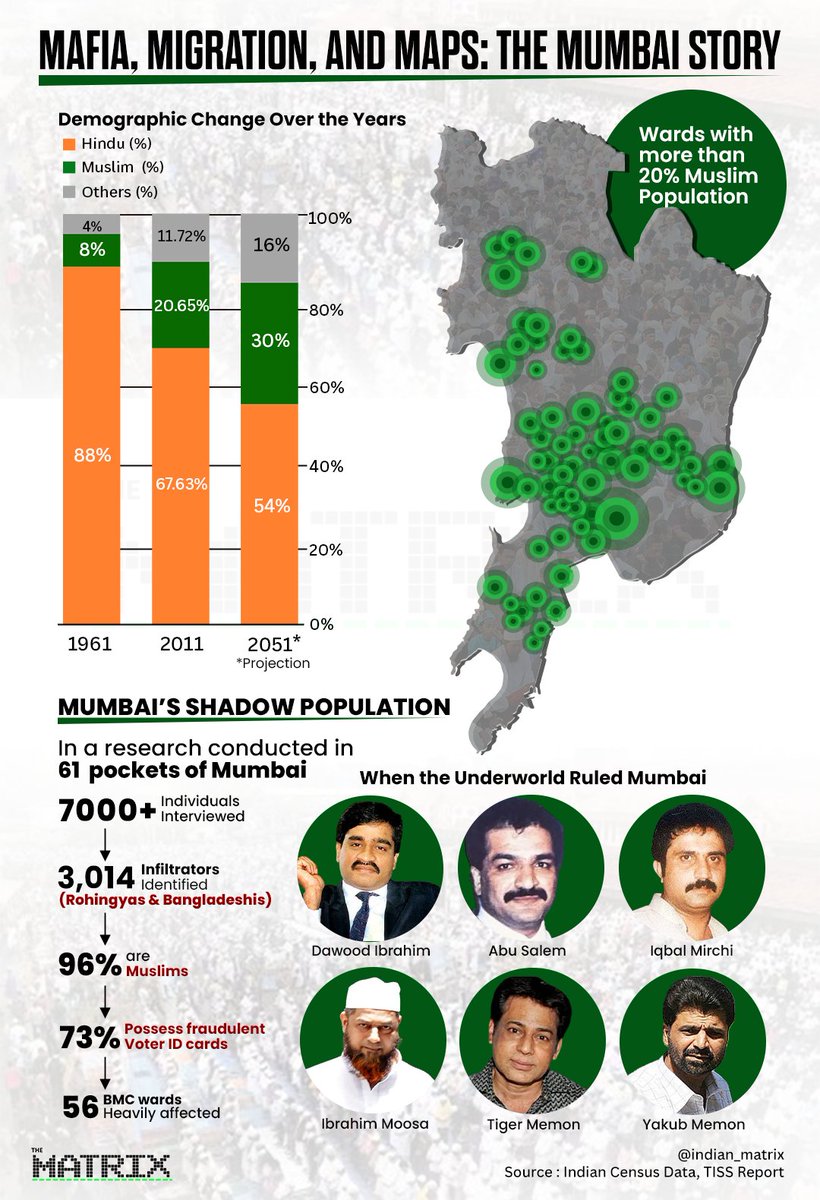 The Trajectory of Decline
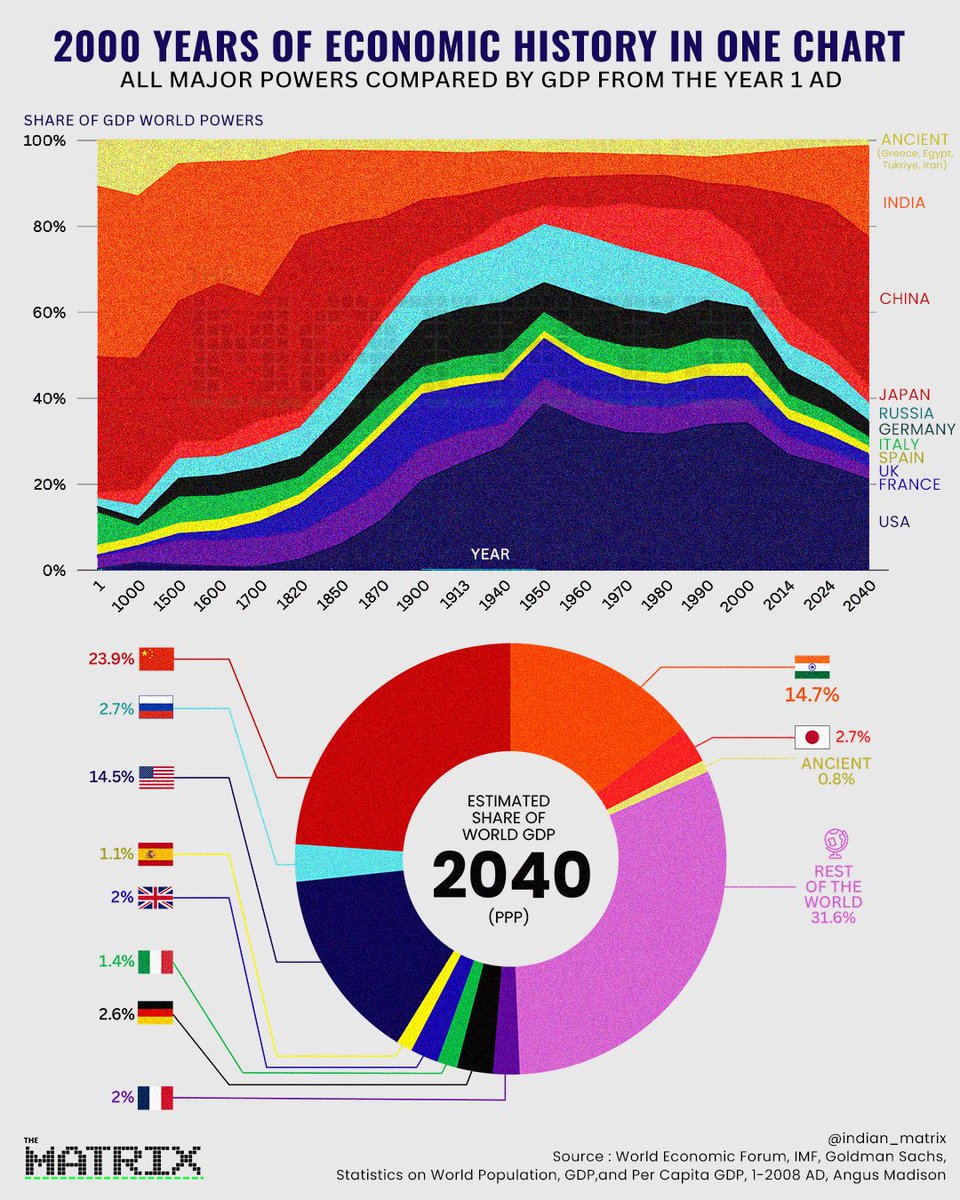 The Default Setting (1 AD – 1700)
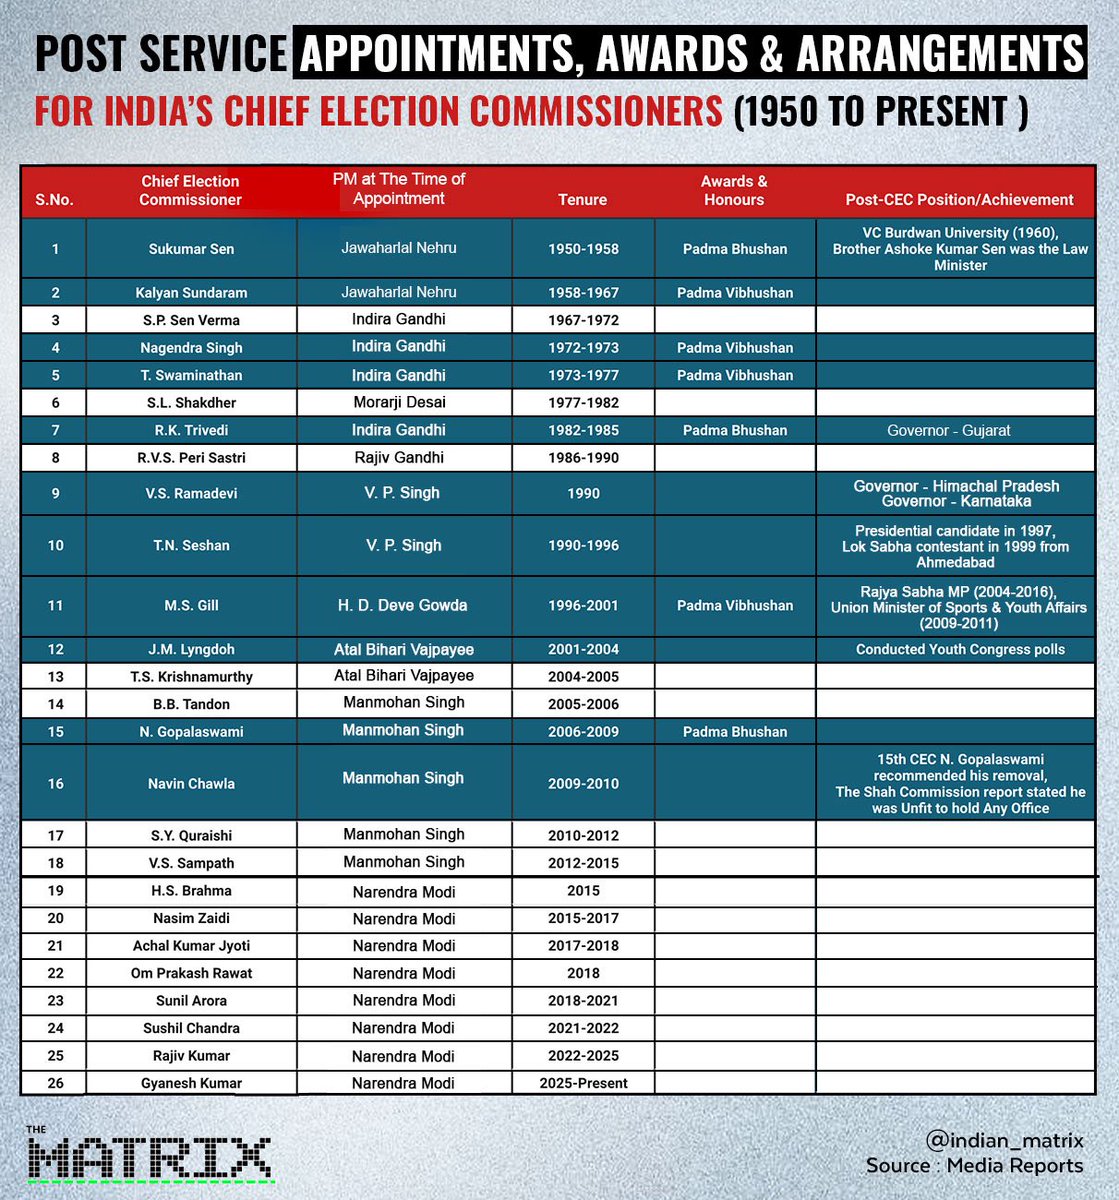 The Era of Honours (1950–2009):
 A data breakdown of the signatories shows a specific concentration within the INDI Alliance.
 By 1940, nearly every American household was already connected to water, sewage, electricity, gas, and telephone networks.
 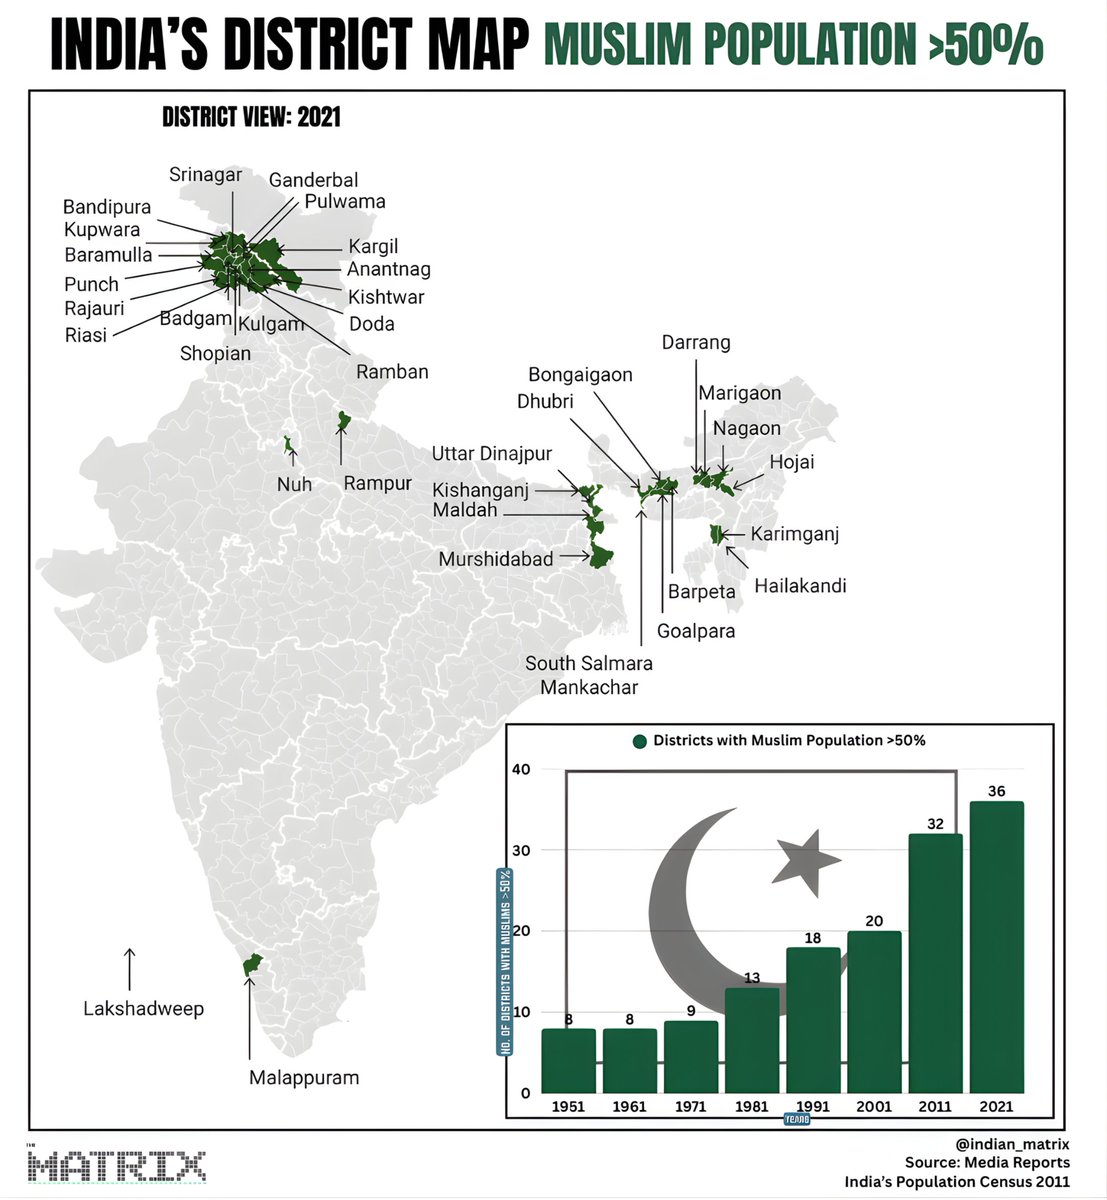 1951 & 1961 - 8 Muslim-majority districts

 The numbers first.
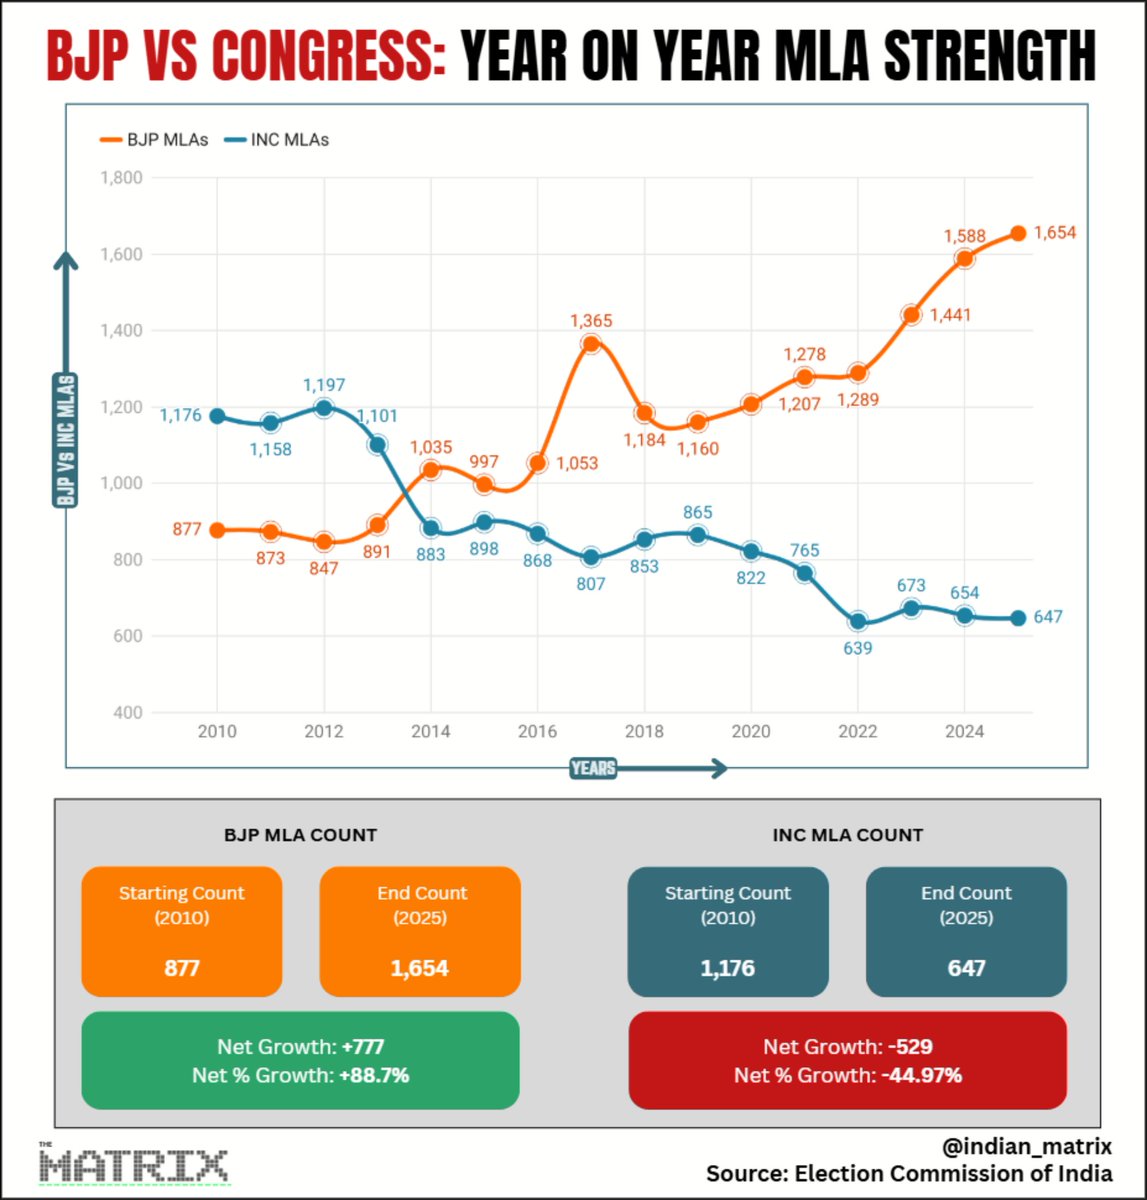 Between 2010-2013, India's political landscape remained relatively stable.
  To understand this MASTERCLASS in crisis management, we need to go back to 1996.
 In 1951, West Bengal was 76.9% Hindu and 19.6% Muslim.
 Why China Was Winning (2000-2013)
 While we were expanding at home, Indian doctors were conquering the world:
 In 1991, India’s EDG ratio reached the alarming levels of 38.7% during the balance-of-payments crisis.
 In 1960, India’s GDP was $37 billion, while that of Sub-Saharan Africa was $36 billion.
 Nehru Era (1947-1964):