Its A Trap Profile picture
Putting thoughts somewhere to keep myself honest so I can learn from what I get right and wrong. Central planning kills the trial + error engine of progress.
Feb 16 14 tweets 6 min read
A lot has been made about the AAII Spread being very bearish near an ATH

Here's what it looks like today...

Let's look at some historical examples

1/nImage The last episode was December 2021 where we reached a new high just as Bears gave up and Bulls went nuts expecting the Santa Rally
The 2022 correction followed during the next OpEx cycle.

2/nImage
Aug 5, 2024 43 tweets 11 min read
BTFD Checklist Time:

✔️New Highs vs New Lows
✔️Composite Vol
✔️Put Volumes
✔️Down vs Up Volume
✔️Put Call Ratios
✔️Realized Vol vs Implied Vol
✔️VIX Futures Inversion
✔️VIX
❌Breadth
❌Technicals New Highs vs New Lows

Not crazy crazy, but it movedImage
Jun 20, 2024 9 tweets 3 min read
This one is for @KeithMcGartman

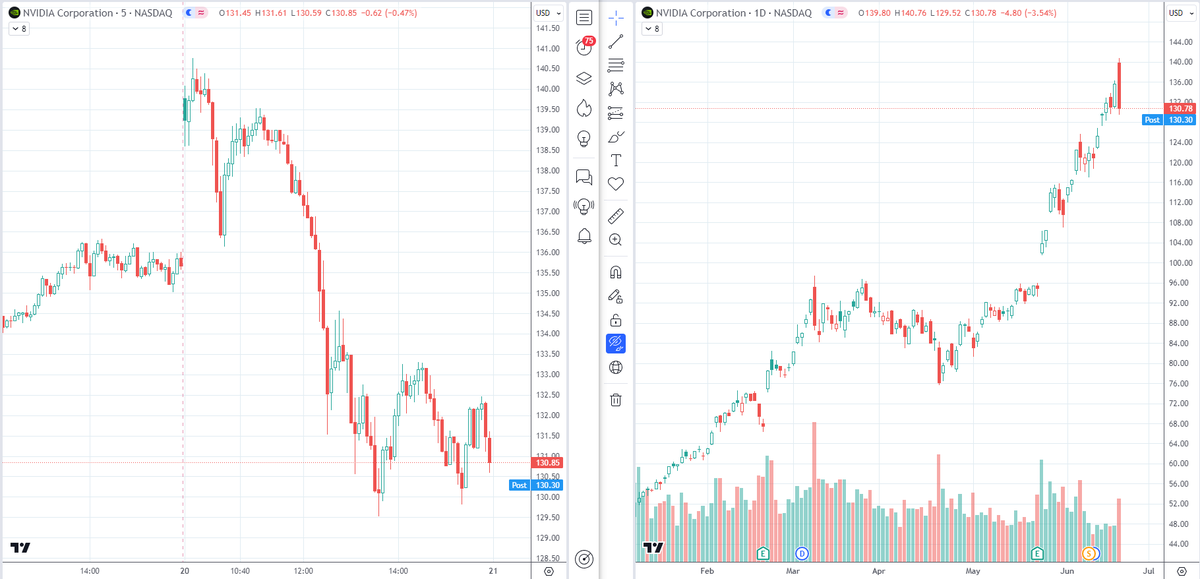
While there have only been 8x days like today where $NVDA had such a large intraday swing into an outside bar like this... it was a fraction of the volume we've seen in similar pattern behavior.

Might be holiday volume shenanigans
Might be the unwind of lots of call options

Let's take a look....

1/♾ June 20, 2024

The waterfall selling seems fairly obviously derivatives related despite all the celebrations about the $XLK rebalance

2/nImage
May 23, 2024 17 tweets 7 min read
Every CORRECTION of the last 5-6 years has started with a day like today...

The intraday move High-Low or the Close-over-Close move was 2-3x the recent Average Daily Ranges...

Many have been characterized by big outside candle technical setups

1/nImage We had a robust response to the short-vol-covering correction giving light participants yet another chance to BTFD late in the cycle

We got the last major earnings mover last night in $NVDA which illustrated a lack of acceleration nor deceleration in fundamentals - enough to pop itself inside of what the options market was pricing, but not enough to buoy the whole of the market

2/n
May 2, 2024 7 tweets 4 min read
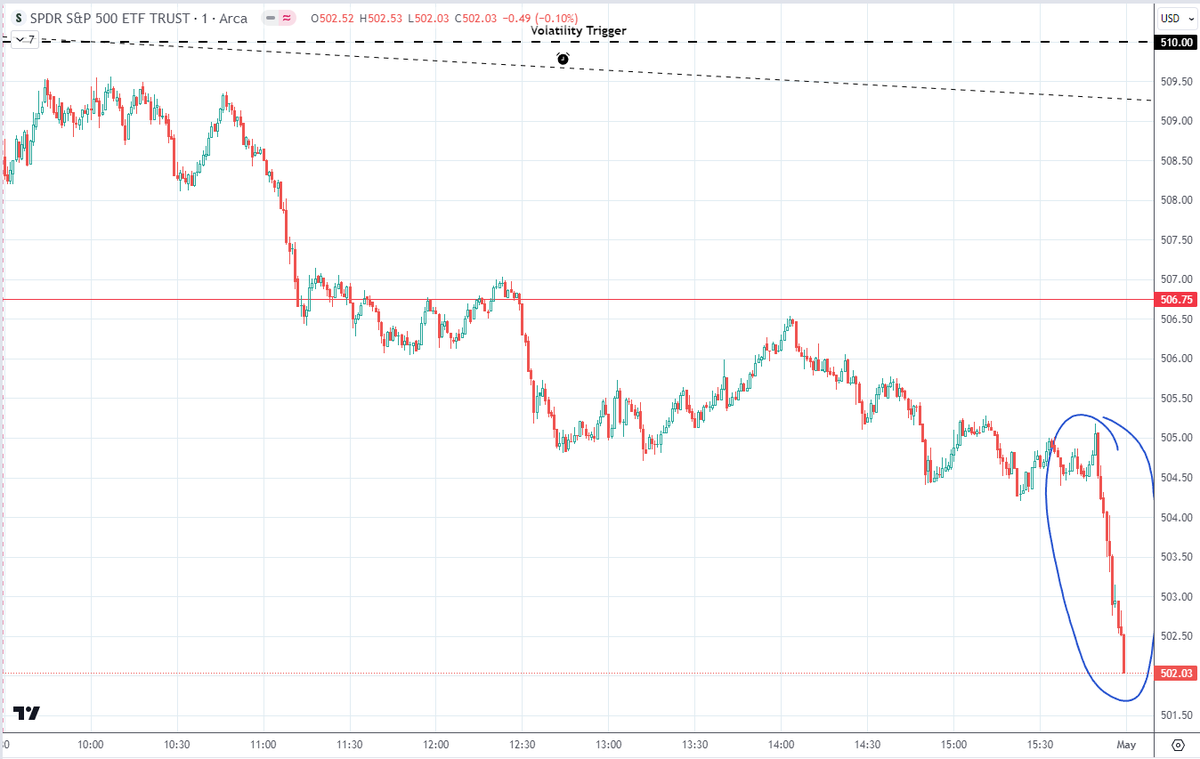
Yesterday's about face into the close is a fairly rare occurrence...

We saw a ~1.5% rally of the SPY 500 level into/thru more Fed speak before a profit taking collapse into the close right back to the 500 anchor.

Let's take a look at the few instances of similar behavior

1/nImage January 30, 2008

End of 2007, the Fed had just begun cutting and the popular narratives were that the "Economy was Very Resilient" despite a variety of red flags and concerns appearing at the margins of the markets and economy.

2/nImage
Image
May 1, 2024 13 tweets 4 min read
That last 10 minutes today was in the top 1% of end-of-day slides over the last 20 years

Does it mean anything?

Is it just end of month shenanigans?

1/nImage Today was the 51st largest end of day slide.

33 of the top 50 came in 2008 or 2020 in the midst of much more volatility.

Today could very well just be the new normal given the onslaught of influence from the derivatives markets.

2/n
Apr 4, 2024 12 tweets 3 min read
July 4, 1983 is the only day that had a similar magnitude intraday reversal from so close to a local intraday high... the next 12 months the broader market grinded lower about 13%Image Loosening those criteria for similar behavior...

9/4/1979Image
Feb 8, 2024 23 tweets 8 min read
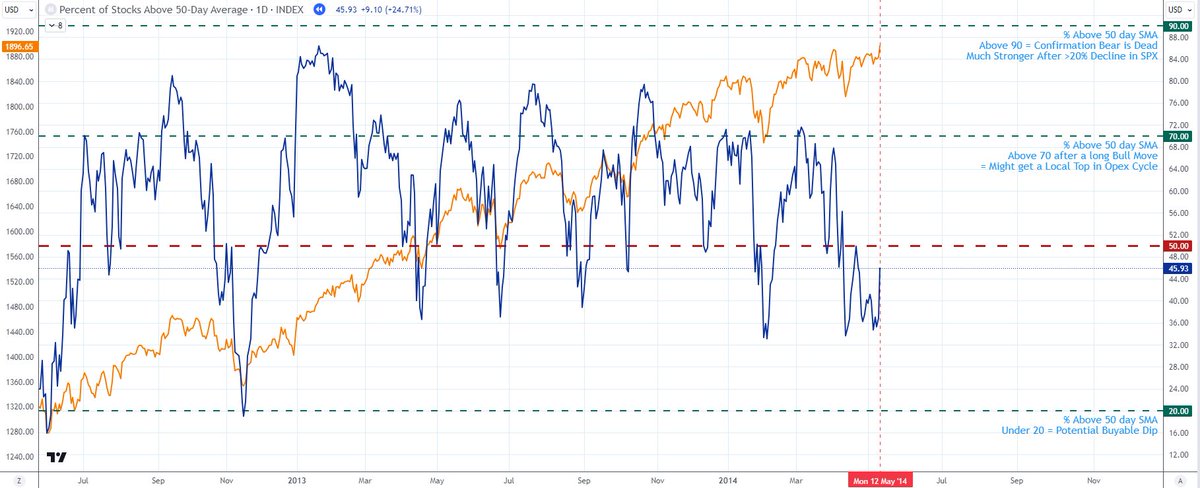
Percent of Stocks Above 50 Day Moving Average

Been a few posts about lack of breadth in many forms... let's take a look at this one:

Are there any other examples of prices marching higher while this indicator falls this substantially?

Yes

1/nImage May 2014

Market had been trading higher for some time with several dips below 50, but this instance had spent some considerable time below 50... with every dip in the indicator coming with a meaningful dip in the index.

2/nImage
Jan 19, 2024 19 tweets 6 min read
End of Week look at some data...

Call Volumes exploded higher today
Put Volumes have fallen off

PVOL / (CVOL+PVOL) back near recent lows...

Not bullish

1/nImage
Image
Image
Similarly, Calls vs Puts on just Equities saw a sharp reversal today

2/nImage
Nov 8, 2023 31 tweets 12 min read
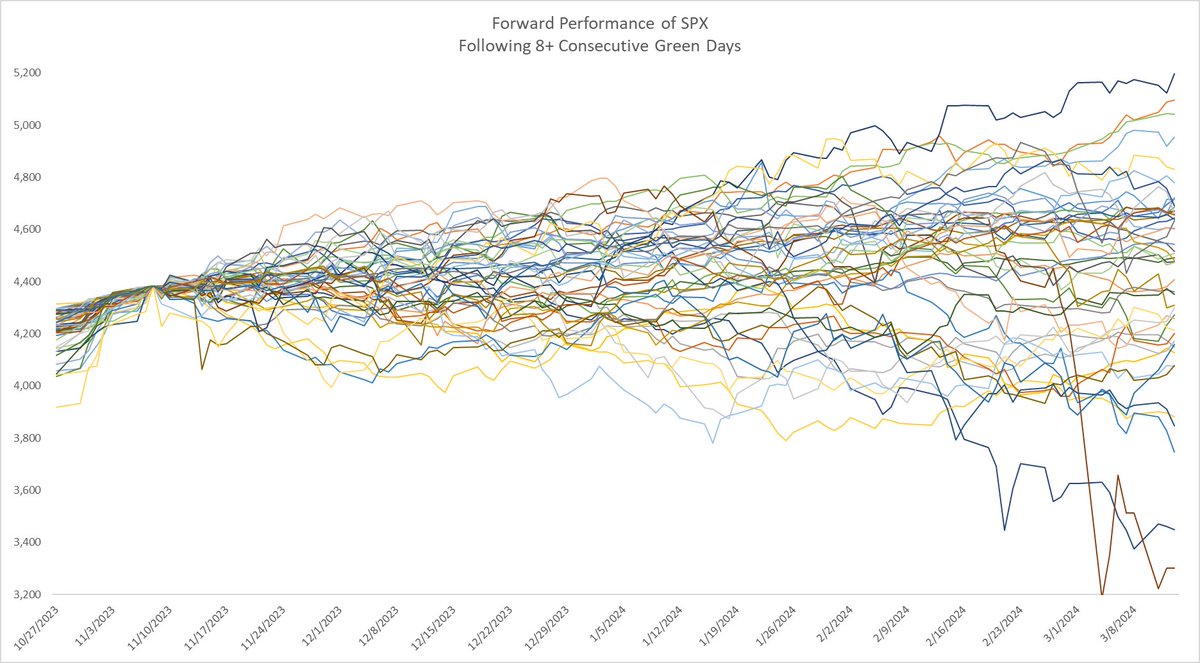
A look at what comes next after 8+ consecutive green days for the SPX

First look is a sample of all 48 instances since the 1950s and the next 90 trading days

Average +1.2%
Median +2.5%
Worst -25%
Best +19%
% Positive 60%

1/n

Image Now, narrowing the focus to these events that occur before a Recession during a Late Cycle leaves us with a sample of 7
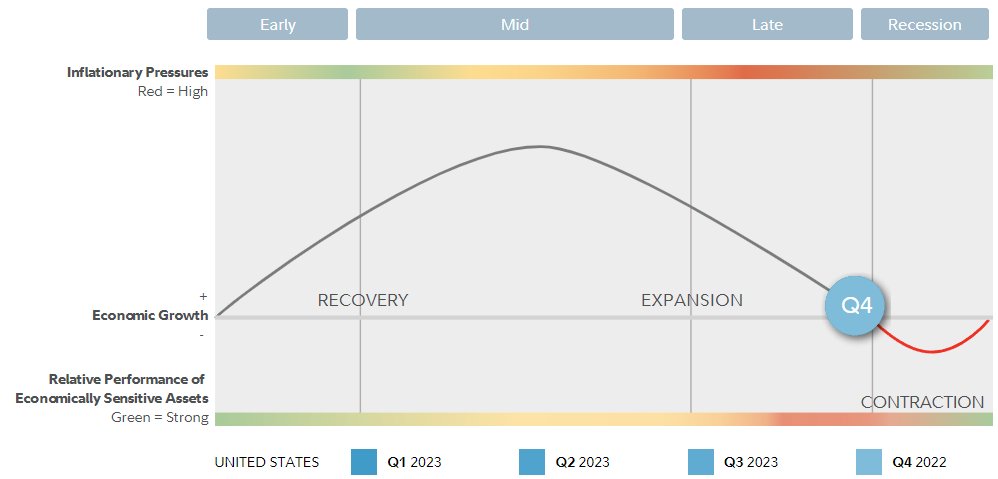
Average -2.9%
Median -4.6%
Worst -15%
Best +13%
% Positive 29%

While the worst case scenario (87 crash) was removed, the outlook wasn't nearly as great.

2/n
Image
Image
Nov 3, 2023 31 tweets 16 min read
How have other 6-day >6% rallies looked the last few decades?

A 🧵

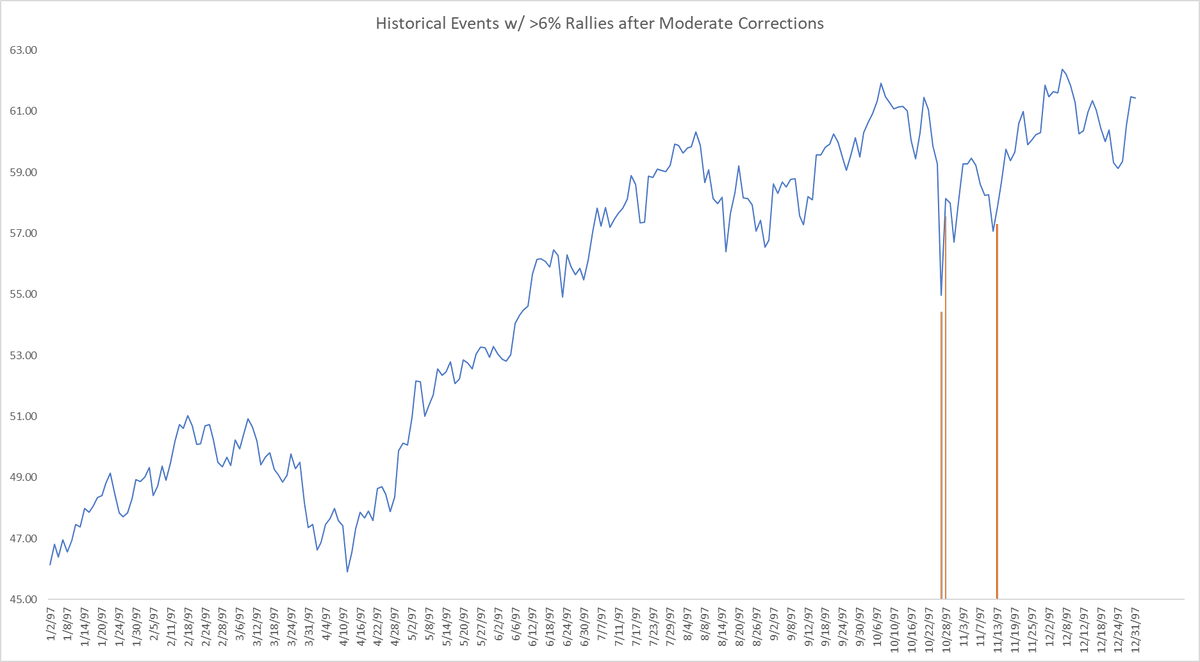
October 1997

The Asian Contagion Mini Crash resolved higher in a v-shaped ramp

It quickly retraced 50% of that pop before continuing the broader bull market run.

1/n
Image October 1998

Coming out of the LTCM correction the market bounced and never looked back

2/n
Image
Aug 18, 2023 26 tweets 10 min read
Today gave us a fairly textbook bottoming bounce on a Friday OpEx after a solid correction...but is this a buyable dip or could it fade easily?

Today's action with the gap down and rally looks a lot like the BTFD ramps after the little corrections in 2021 notably in around OpEx in July, August, December where the VIX curve was still in contango and also the May 2022 OpEx bottom where VIX curve was in backwardation

The rally today jumped off the @spotgamma Put Walls on SPX, SPY, QQQ, IWM

Among the technicals:
- SPX broke through the Mar-June support after slicing the 50day
- QQQ broke a similar setup and is sitting on its lower 50d BB
- IWM cracked the weak shorter term MAs and it sitting right on a trendline and the 200day

Many other technicals are setup for a bounce like ARKK, TLT, KRE, XRT, DJT, ITB, SMH among various trendline supports, channel supports, or moving averages... with the same story applying to many key individual stocks like AAPL, TSLA, GOOG, META, AMZN, etc.

We seem to have the recipe needed for a good bounce... but why do we get the feeling it ain't over yet / the bounce will be anemic?

Image
Image
Why might the bounce be short-lived or shallow?

Obviously, nobody can predict the future, etc.

Also, the action on Monday could make the 'bounce' call much easier to stick with... and expand into a further 'rally' call... we'll see

Using MSFT as an example, it's visually easy to see the trendline support from one technical perspective but the moving average technical support is mixed with the 200day quite a distance away at a time where the Fundamentals are still expensive and the Macro is giving us a deliberate headwind

The same story is true for many individual stocks and indices.
Image
Jan 25, 2022 6 tweets 8 min read
@bhxalien @DereckCoatney @sentimentrader 3.3 trillion derivatives with lots of deep ITM expired last week while the mkt was rotating violently between growth value b/c Fed tapering = directional policy change

Derivatives caused massive negative Gamma environment where dealers were massively feeding into the moves... @bhxalien @DereckCoatney @sentimentrader There is usually a wash out the day after OpEx (today) and the opening gap is usually opposite of the next few days direction as left over imbalance gets fixed between Euro session and US am session... so gap down, run down, then invert and rally

Today's rally was Vanna +