
Scientific Director, Public Discourse Foundation & Senior Applied Scientist, @ETH | past: Quant Editor, @FiveThirtyEight | PhD, @LSEGovernment | she/her
 Using a minimalist, "bare-bones" definition of democracy -- voting in favor of election results, against insurrections, and such -- some Republicans turn out to be quite supportive of democracy.

 First, the overpolicing of Black Americans (nytimes.com/2017/07/03/opi…, features.propublica.org/walking-while-…), and the cycle of fines and fees people end up stuck in, leading to jail time (theappeal.org/the-lab/explai…, npr.org/2014/05/19/312…)
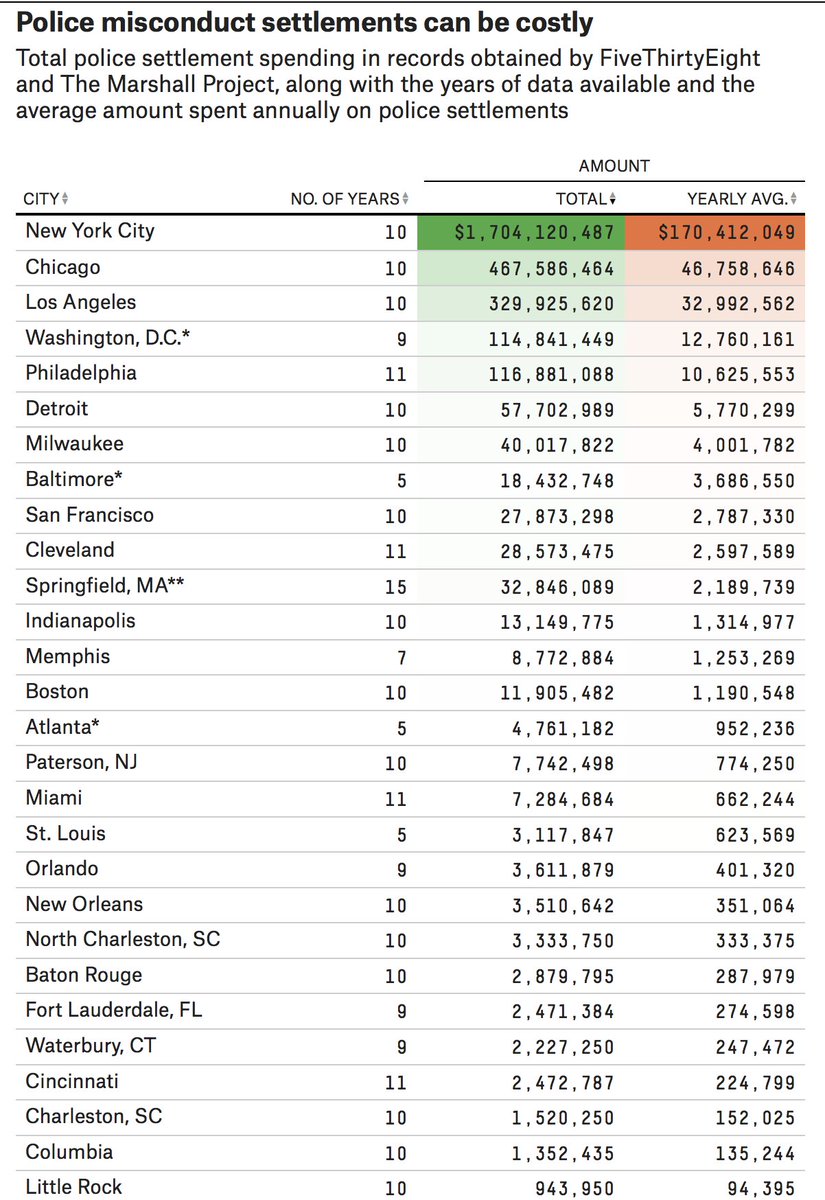
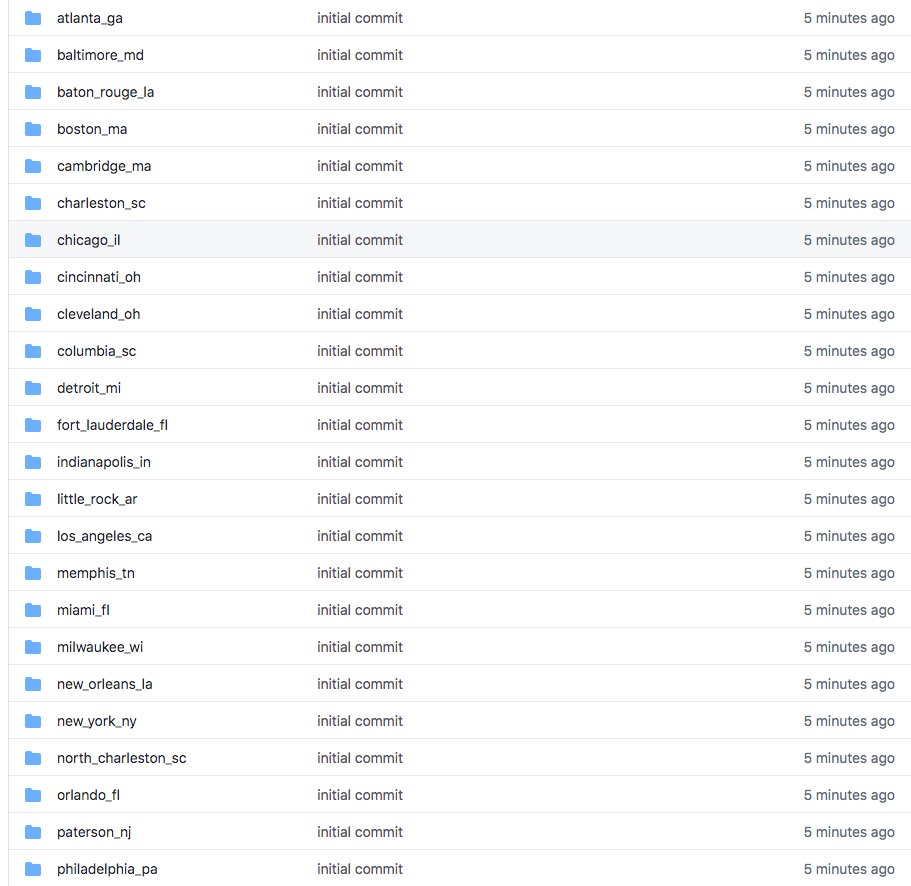 But we want to encourage responsible use of this data! It's *not* comparable across cities, which is why we're not providing it as an easy-to-use, pre-compiled data set. We want you to use it -- but we want you to read about its idiosyncrasies first!
 Cities don't track this money in a straightforward, comparable way. Indeed, some don't seem to track it at all.
 The biggest shift towards Biden was in suburban counties that became *both* more diverse *and* more educated over the past decade -- a lot of the GA suburbs fall into this category.
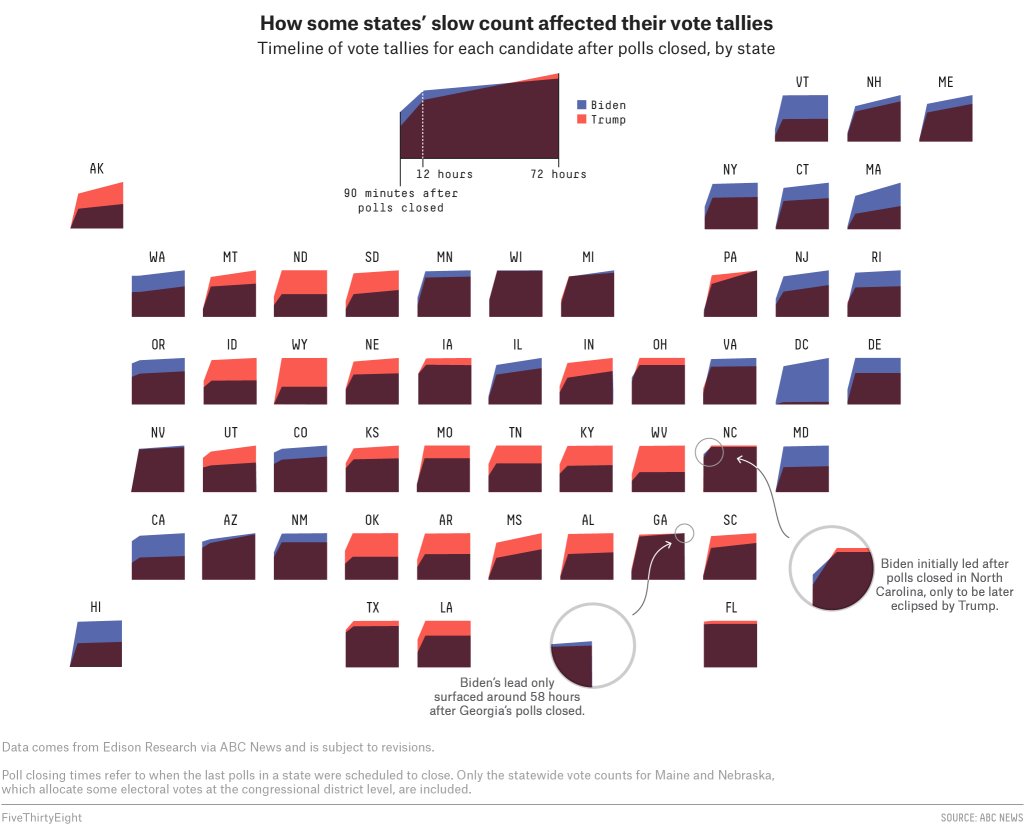 In some states, generally those where absentee votes were processed before Election Day, the race looked competitive after 90 minutes, only for Election Day ballots to conclusively put Trump in the lead. (Missouri and Montana are also in this category.)
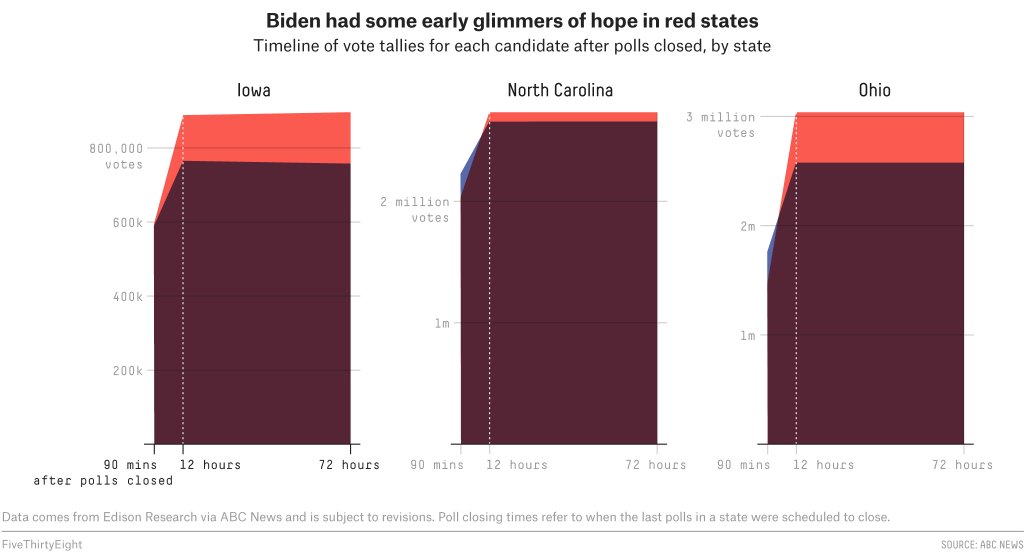

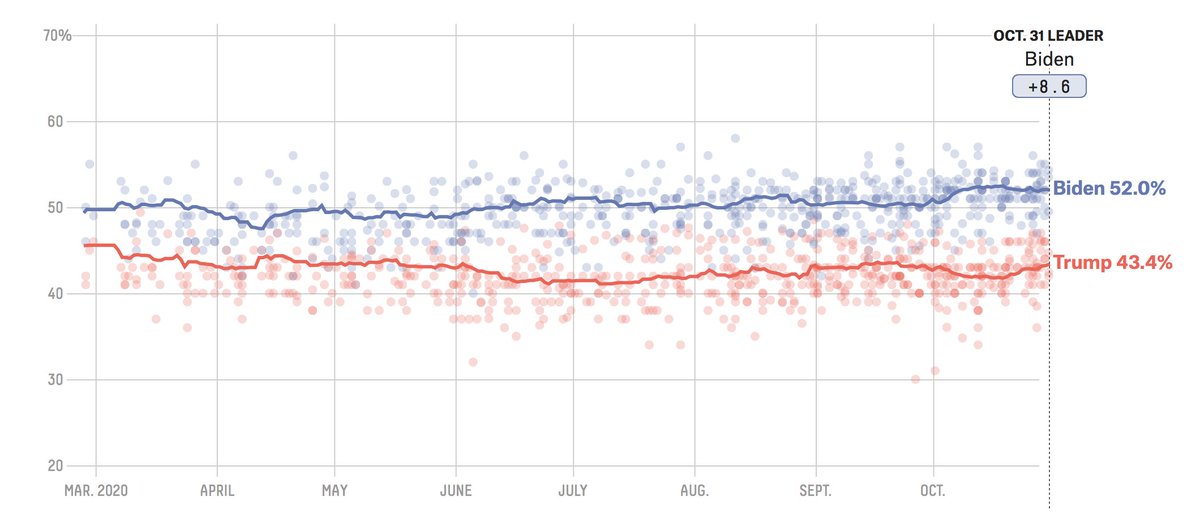 2. There are fewer undecideds than 2016.

 (+ bonus charts!) How do we know young people aren't more apathetic? Well, they're not significantly more likely to say they don't vote because the system is too broken, or because they don't believe in voting. But they *are* more likely to say they wanted to vote, but couldn't.
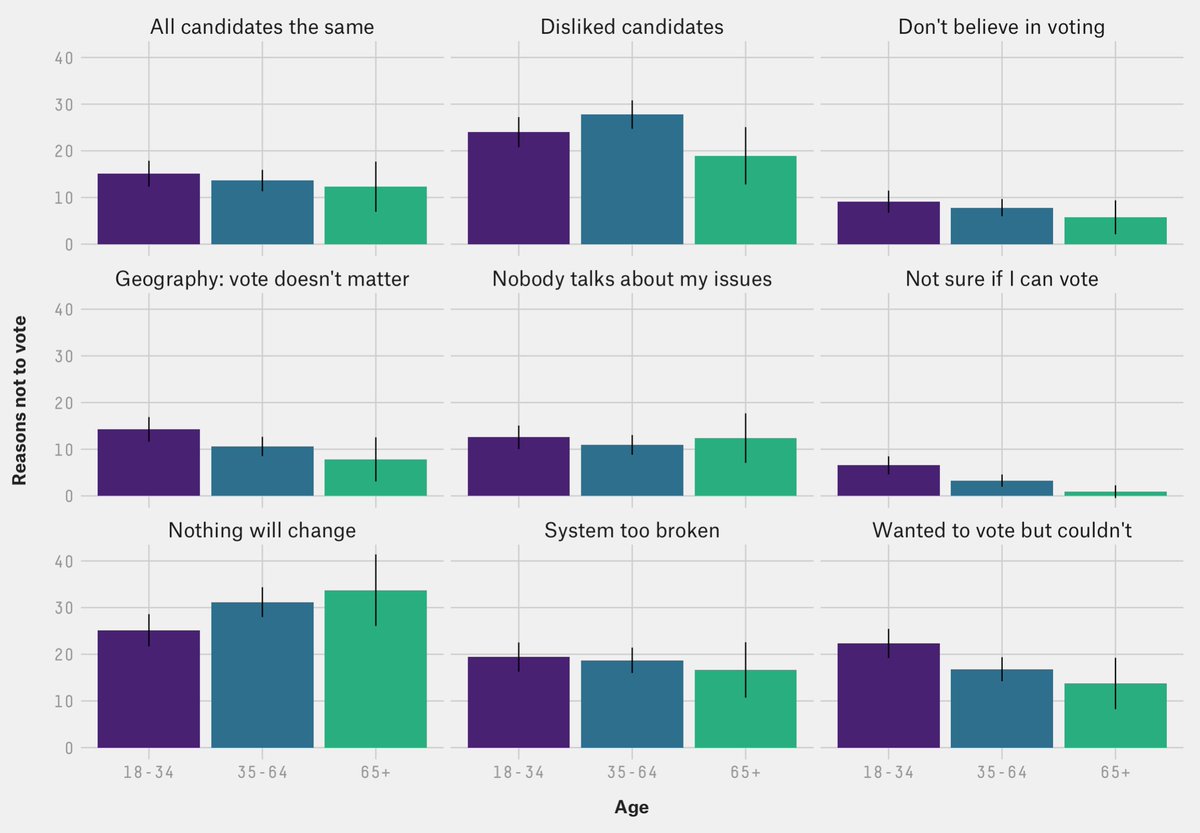
 In short, as the paper explains, looking at use of force just among the set of people police have *stopped* isn't enough to let you correctly estimate racial discrepancies. If there's bias in who gets stopped in the first place, that confounds your estimate.
 To check for herding, I took the 18 polls released since Aug. 1, and simulated the standard deviation you'd expect based on the polling average and sample sizes. I compared that to the actual standard deviation of the polls, which turned out to be *a lot* smaller.