📈 Len Kiefer 📊 Profile picture
Deputy Chief Economist at Freddie Mac. I help people understand the economy, housing, mortgage markets.
Dec 8, 2022 8 tweets 2 min read
What are the macroeconomic implications of a modest (5-10%) decline* in U.S. house prices?

I think context is important here or you might miss the point.

*5-10% isn't necessarily my forecast, but it's a number I've seen around Time series chart of U.S. house price appreciation from FHFA First, whether or not a 5-10% decline in house prices would be modest or not is context specific. In a normal environment a 5-10% drop would probably be more than modest.
Dec 7, 2022 4 tweets 1 min read
U.S. home purchase mortgage applications are down 40% from a year ago, off 50% from their seasonally adjusted 2021 peak. time series chart of U.S. home purchase mortgage application refinance activity is not 0, but it's the lowest it has been in a long long time time series chart of US refinance mortgage applications top
Jun 9, 2022 5 tweets 2 min read
The U.S. housing market is at the beginning stages of the most significant contraction in activity since 2006.

It hasn't shown up in many data series yet, but mortgage applications are pointing to a large decline over summer.

Purchase apps down 40% from seasonally adjusted peak 
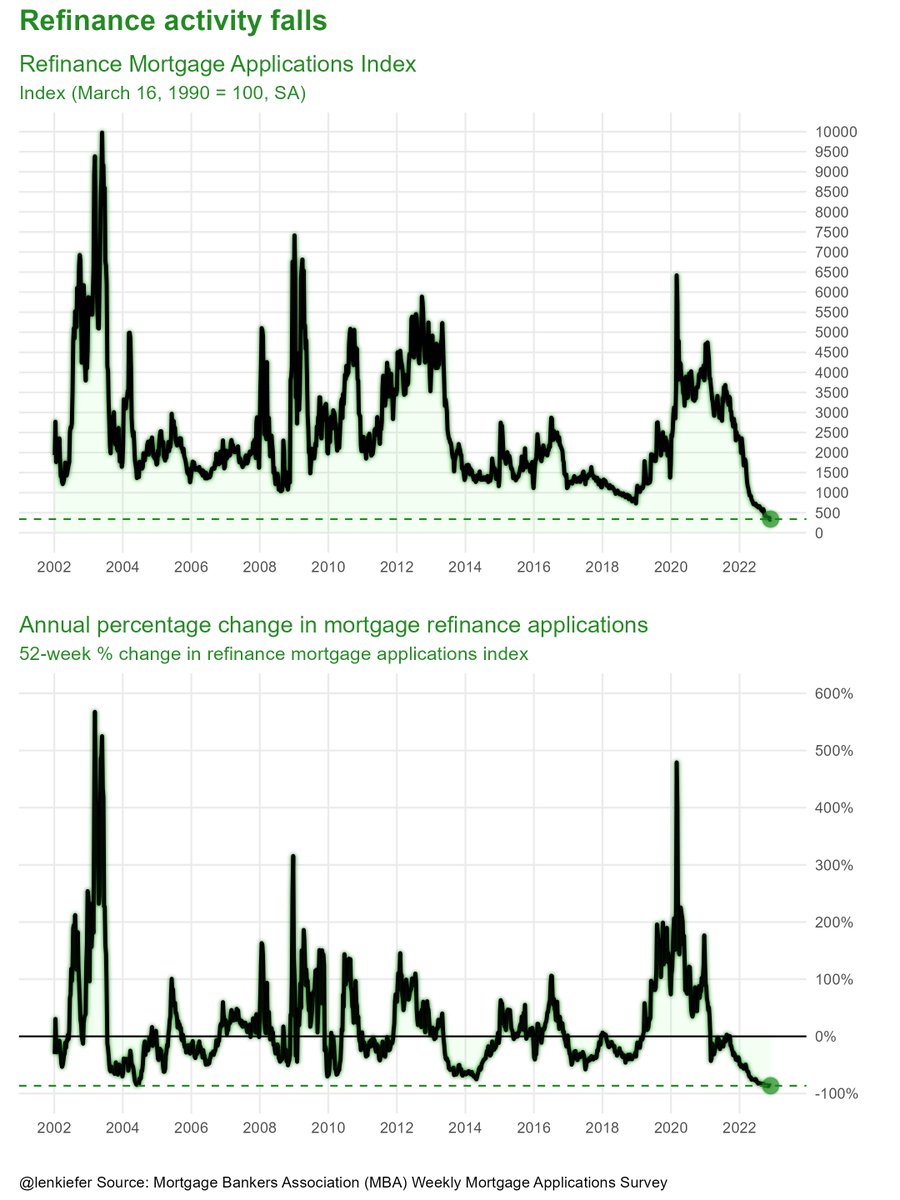
during COVID in spring of 2020, applications also fell 40% but came roaring back in short order

such a rebound is unlikely in the current environment

but neither is the very very slow recovery we saw in 2011
Feb 2, 2022 4 tweets 2 min read
Back in 2009 the U.S. had an excess of 1.9 million vacant housing units. As of the fourth quarter of 2021 there was an undersupply of 1.8 million vacant units. US housing oversupply chart I caculated the undersupply by comparing the current homeowner/renter vacancy rate (very low) to its historical average

then computed how many more vacant units you would need to add to get vacancy back to historical average (dotted lines in chart) time series of US vacancy rates
Jan 31, 2022 4 tweets 1 min read
From Dec 2000 to Dec 2021, nominal house prices in Los Angeles metro have increased 255% vs 85% in Cincinnati metro

that's 3x as much house price growth in LA... who dey housing market char... ...income growth has been slightly faster in LA, but not by much
from 2000 to 2020 (2021 data not available yet) per capita income in LA was up 118% vs 92% in Cincinnati Image
Oct 17, 2021 4 tweets 1 min read
If house price growth goes from 20% to 5% annualized rate, I suspect it will create a narrative vortex where everyone's wildest dreams and darkest fears are all simultaneously confirmed That's kind of deceleration is pretty close to the consensus forecasts for the US over the next year or so (with as always outliers on both sides)
Oct 22, 2020 5 tweets 2 min read
Did sentiment turn positive in the October Fed Beige Book Text mine sentiment score for Fed Beige Book Mar 2008-Oct 20 "weak" terms showing up less frequently Word count Stong vs Weak terms in Fed Beige Book Mar 2008 -
Oct 22, 2020 7 tweets 2 min read
What to make of that giant US existing homes sales print this morning?

I wouldn't get overly excited, it's still primarily catch up from a lost spring.

Consider this chart (i'll explain) 1/n US existing home sales vs pre-pandemic trend If you follow me, you've seen me do a chart like that for weekly home purchase mortgage applications, which pick up related trend (not all home sales get mortgages)

If not, welcome friend, and see here 2/7
lenkiefer.com/2020/10/10/hou…
Oct 22, 2020 4 tweets 2 min read
US weekly average 30-year fixed mortgage rates, 2.80% this week.

A record low

freddiemac.com/pmms/ Time series of US weekly average 30-year fixed mortgage rate 
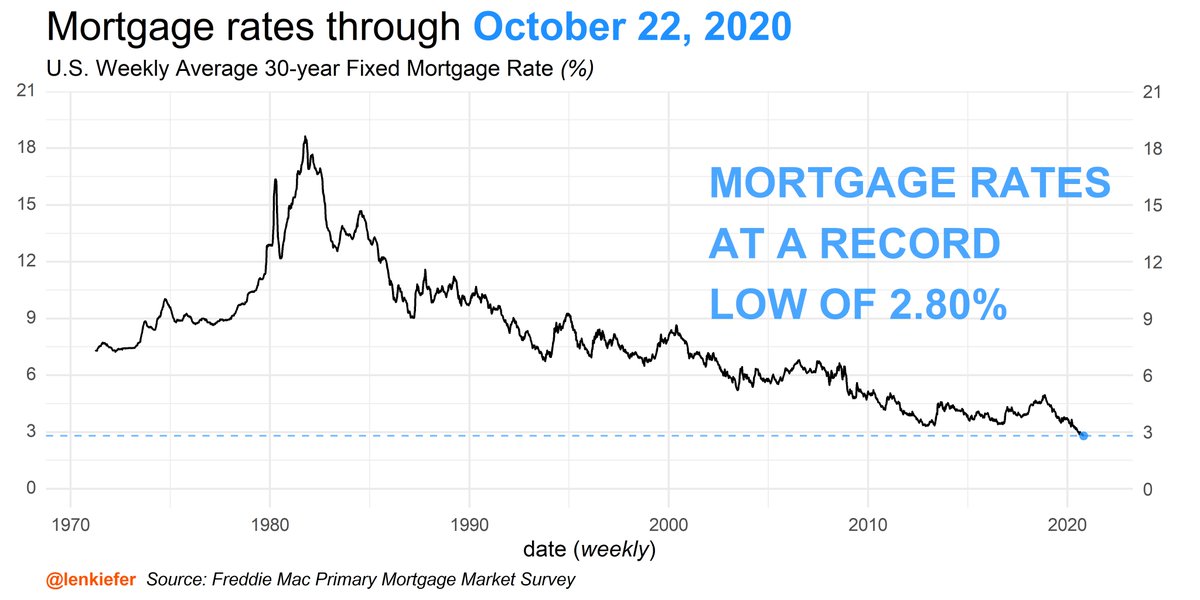
rates almost reached 5% in November of 2018 and since have been on a steady decline time series chart of weekly US mortgage rates 2018 through O
Oct 21, 2020 5 tweets 2 min read
US home purchase mortgage activity US weekly home purchase mortgage applications by week of yeaUS weekly home purchase mortgage applications by week of yea compared to pre-pandemic trend US home purchase mortgage applications in 2020 compared to p
Oct 20, 2020 4 tweets 1 min read
US single-family housing starts: Chart of 1-unit US housing ... link to report
census.gov/construction/n…
Sep 12, 2019 7 tweets 3 min read
#mortgage rates tick up this week
freddiemac.com/pmms/

charts!
1/ still super low though

2/
Jun 12, 2019 14 tweets 6 min read
Assuming we aren't in recession right now, the current expansion will tie the 1990s expansion for longest in U.S. history. Let's take a look at how housing markets have behaved in this expansion relative to earlier ones
a thread... hold on, wait.
let's back up.
here's a typical chart of U.S. housing starts, with expansions/recession shaded
then, overlaid...