Design principles for technical documentation: a thread
Why do we need design principles for technical documentation? Usually technical docs are a collaboration between engineers, product managers, technical writers and editors, and sometimes marketing. All of these stakeholders have their own ideas about what makes "good" doc.
Mar 13, 2020 • 23 tweets • 6 min read
Hello, good afternoon, let's do another mappy Twitter-torial, shall we? Today's topic is visualizing aggregate data. Mostly it's a critique of this map, which you've probably seen quite a bit. It has great data! But I take issue with the techniques used. arcgis.com/apps/opsdashbo…
We are all familiar with maps that visualize aggregate data. The most common one you've probably seen is a "choropleth" map -- a map of areas that are filled in with a color or pattern that tell you something about that area. Like this electoral map from the BBC:
Mar 12, 2020 • 20 tweets • 5 min read
Since we're all at home panic-refreshing Twitter, let's use this time to learn a new geospatial concept! Today's lesson: converting points to polygons. (If you've ever wondered why cartographers hate on zipcode data, read on!)
Here’s our data! Let’s say it’s addresses where cute dogs live. You want to create a boundary (a polygon) that includes all the cute dogs.
Mar 2, 2020 • 11 tweets • 3 min read
How to write good documentation:
1. Start with a declarative statement about the thing you're writing about. Except in very few cases, this can be structured as "[thing] is [description of thing]" where description is actually a description.
2. Know how you want your user to use the thing, and then tell them to do that. If there are multiple ways to use the thing, make that clear, but provide a preference for when they're first getting started. Get them from zero to user as quickly as possible.
Jan 14, 2020 • 7 tweets • 2 min read
I've been thinking about how it's hard to share things and ask questions and put work out in the world when you're a beginner, and I have some suggestions for ways we as a community of teachers (yes I mean literally everyone who teaches anyone anything) to do better.
1. A common fear among beginners is that the solution/path they took was somehow incorrect, even if they got a good result.
Not helpful: "Why'd you use XYZ? It seems like overkill for this."
Helpful: "Ooh, nice! I've never seen XYZ used in this way. For these problems I use..."
Dec 2, 2018 • 7 tweets • 2 min read
So there's this thing called the Modifiable Areal Unit Problem -- when point-level data is aggregated into geographic districts, the resulting numbers can tell a story that isn't real. These stories change depending on the modifiable areal unit.
Imagine we have this map showing habitat for some species of beetle.
Aug 10, 2018 • 23 tweets • 6 min read
Welcome to Map University. Today’s topic: using mapping APIs for fun and profit.
“API” stands for Application Programming Interface. It’s a generic term for a set of tools, commands, or communication methods that aid in software development.
In the context of mapping, there are two general types of tools that share this ambiguous term:
- JavaScript APIs, or libraries, which contain a set of functions for making maps and map components e.g. Leaflet
- Web services APIs, aka “REST” APIs, which allow you to connect ...
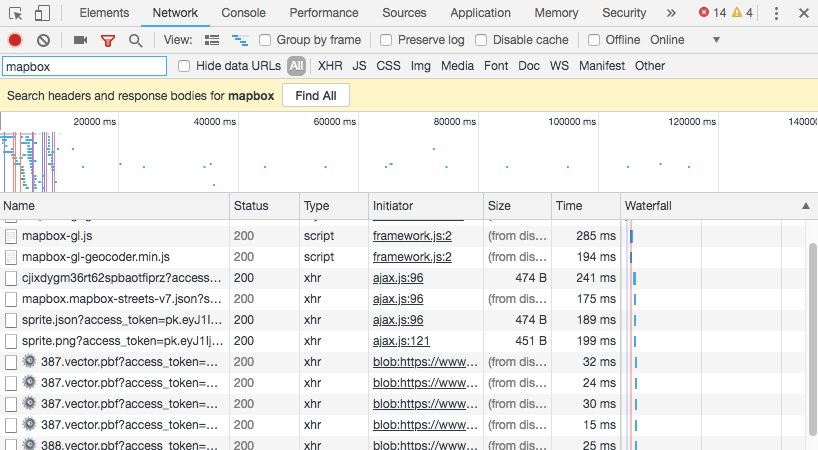
Jul 13, 2018 • 33 tweets • 7 min read
Welcome to the Friday edition of Map University! Today's topic: how @Mapbox GL maps work.
Note: this may require multiple parts both because it's complex and because I'm at the airport.
Maps require 3 distinct pieces/tools/steps: data, styling rules, and a renderer. Every evolution in mapping has changed one of these steps. Indeed, if you look back through the history of Mapbox, you can trace the evolution by considering these three pieces.