Andrew Nalband Profile picture
I help you get smarter faster by visualizing big ideas. CEO/founder of @thunknotes.
begrateful Profile picture Learning in Public - Coding - DataSci Profile picture 2 subscribed
May 3, 2023 13 tweets 5 min read
ChatGPT is changing how I work, plan, and create.

I’m trying to get better at it & figured I’d share what I've learned.

Here are 10 prompts I've used that actually helped me ⬇️ 👀 Image 1/10: Planning/breaking down tasks

This is my favorite use case.

Pro-tip: ask for the results in the form of a spreadsheet/table Image
Mar 17, 2023 11 tweets 3 min read
You have to see this!

10 Old Polaroids Found in a Time Travelers Basement

(comment on your favorite)

🧵

1. Image 2. Image
Mar 17, 2023 8 tweets 2 min read
7 Girls in Renaissance Tracksuits

(which one is your favorite?)

🧵

1. Image 2. Image
Mar 16, 2023 16 tweets 4 min read
15 Powerful Visuals That Will Change Your Perspective

1. Image 2. Image
Mar 16, 2023 8 tweets 3 min read
I just used AI to recreate the 6 original Avengers as grumpy babies.

I can't stop laughing.

🧵

1. The Hulk Image 2. Thor Image
Mar 14, 2023 13 tweets 4 min read
10 visuals I use to stop relying on motivation

1/ Image 2/ Image
Mar 2, 2023 37 tweets 11 min read
The world’s most popular book on habit change:

Atomic Habits

I've spent the past 100 days summarizing and visualizing the best ideas in the book.

Here's what I learned: Image Small repeated habits add up to big changes.

Imagine you’re a pilot flying from Los Angeles to New York City. Just before takeoff you turn right by 3.5 degrees. This tiny change is barely noticeable on the runway. The front of the plane moves only 90 inches. Image
Feb 16, 2023 9 tweets 3 min read
Atomic Habits has sold over 10,000,000 copies.

People are losing it over these 7 visuals I made of hidden insights in the book.

1 of 7: Stack your habits for big wins. Image 2 of 7: Your environment secretly controls you.

Changing your environment is the most overlooked way to change your behavior. Image
Feb 15, 2023 6 tweets 2 min read
How To Master Anything:

4 VISUALS explaining the stages of MASTERY by which we acquire new skills.

//THREAD// 1. Unconscious Incompetence

You're unaware of your lack of knowledge.

This is the stage of ignorance.
Feb 14, 2023 11 tweets 3 min read
10 🌶 Tweets about why you should NOT use Markdown to edit your notes...

**From the CREATOR of Markdown**

1/ Markdown should only be used for EXPORT 2/ Markdown is SPIRALING OUT OF CONTROL
Feb 7, 2023 7 tweets 3 min read
The simplest techniques are often the most useful.

Progressive Summarization from @fortelabs is one of these tools.

Here's how it works.

Step 1: Take a digital note and mark the key ideas in bold: Image Step 2: When you revisit the note, highlight the "best of" the bolded parts: Image
Jul 27, 2022 8 tweets 5 min read
I'm spending the next 100 days creating visual summaries of great productivity books.

I'm starting with Building a Second Brain by Tiago Forte.

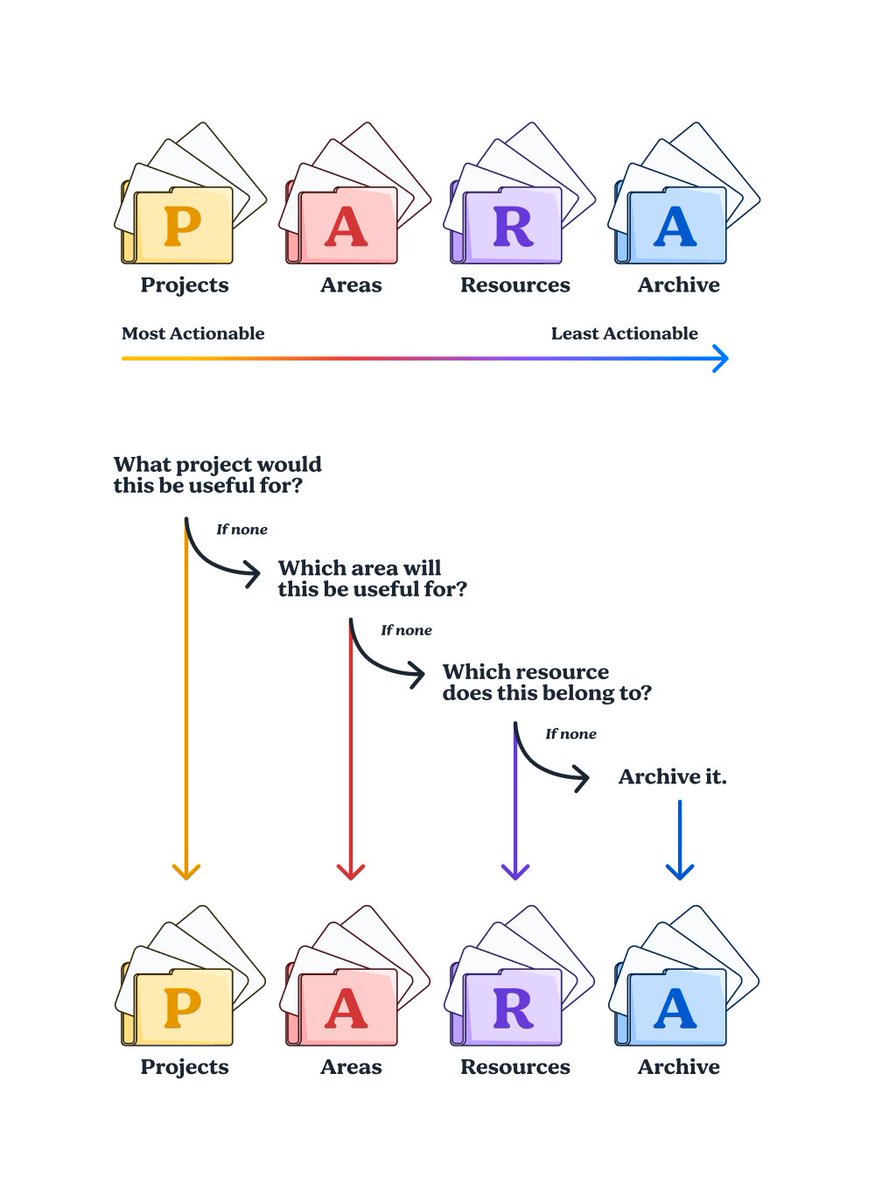
This is a visual of his PARA system. Here's how I made it.

——Thread——

👇 I started with an illustration I bought online.

I made a few edits, and displayed one letter of PARA per folder.

👇
Jun 3, 2021 9 tweets 3 min read
1/8 To build an audience you need to offer them something of value. We often lose sight of this simple and obvious truth. To offer value you need to understand two things:

1. Yourself
2. Your Audience

The first and most important thing to understand is you. 2/8 Most of us don't understand the value we are already offering. Without being aware of it, you constantly bring value to those around you. Your friends and coworkers spend their time with you because of this. Every dinner, lunch date, Zoom call—this is why people show up.
Apr 2, 2021 6 tweets 3 min read
1/6 I spent some time today exploring visual treatments for our graph view in Thunk. @observablehq is ridiculously fun for this. I'm a total novice, but it's fun to explore different ways a network graph can look. This is how our graph looks now.
observablehq.com/@nalband/disjo… 2/6 I found this gorgeous network image on pinterest and wanted to see if I could get a similar look in @d3js_org.
Apr 1, 2021 5 tweets 2 min read
1/? At thunkjournal.com we have an aspirational value I'm trying to get better at. We call it Share & Show. I have to thank @lightfiend for inspiring me to see the power of this. I've gotten much better at this in our internal Slack, but I still suck at doing it in public. 2/? I'm going to create this thread and update it over time with links to other threads. Each link I share here will be a public record of my work on some problem we're trying to solve at Thunk.
Apr 1, 2021 14 tweets 6 min read
1/? I'm trying to come up with a good way to display notes with large titles for the graph view we're building. The graph view shows you connections you've made between your notes. The purpose of this view is to help you discover patterns in your thinking and create new ideas. Here's how the first version of our graph view looks in Thunk with and without titles. You can probably already see the problem here. More on this later. :)