Nenad Bakic Profile picture
Cultural Entrepreneur; Serial Entrepreneur; Mathematician
Dec 31, 2022 10 tweets 3 min read
Što si vam radili u 2022. - NAJNELJUDSKIJA ZASTRAŠIVANJA - thread

Infodemija ima sjajan alat, vremenska crta infodemija.org/timeline/tijek…

Malo sam pogledao, ali previše je toga 😥... evo ipak nekih bisera

1/11 2/11
Nov 5, 2021 11 tweets 3 min read
Cijepljenje ima jako velik utjecaj na smrtnost

Cijepljenje jako smanjuje hospitalizacije i smrtnost, pogledao samu učinke u EU.

Smrti u zadnjih 7 dana na mil. i obuhvat (potpunog) cijepljenja za starije su visoko korelirane varijable: čak 89% jedne je opisano drugom!

1/ 
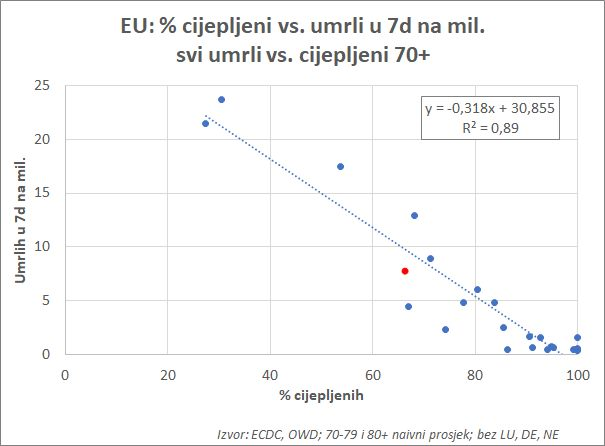
Često se kaže 'korelacija nije kauzalizacija' (možda im je obima uzrok treća varijabla ili je utjecaj obrnut), ali to su vrlo komplicirana pitanja - štoviše, ovogodišnja Nobelova nagrada iz ekonomije je dodijeljena upravo za tu temu.
2/
Jun 6, 2021 5 tweets 2 min read
A curious case of Croatia which switched from hard to soft measures

In the 2nd wave Croatia made a unique move in switching from very stringent to very liberal measures. This chart show differences in stringency for all EU countries:

1/5 
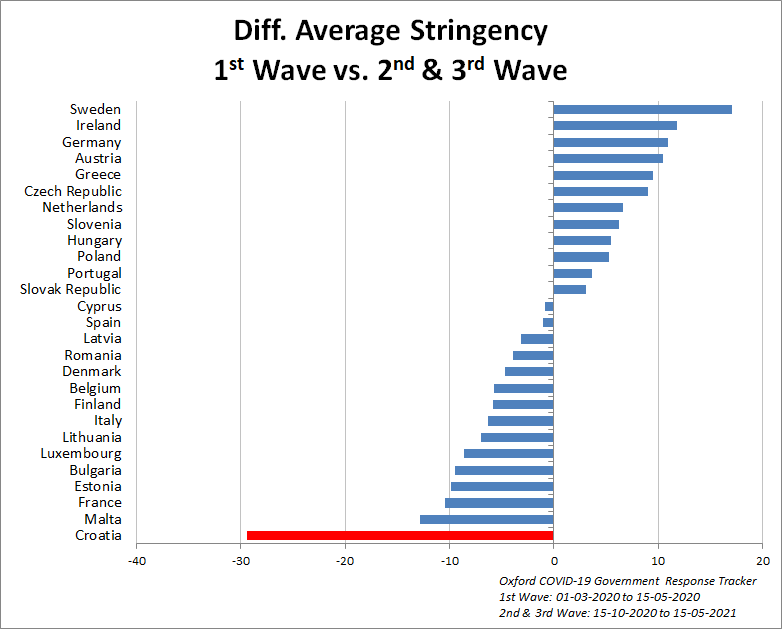
Stringency during the first wave (01-03-2020 to 15-05-2020):

2/5
May 22, 2021 9 tweets 3 min read
Iznimno zanimljivo istraživanje Eurobarometra, neke stvari:
Hrvati su nešto iznadprosječno zadovoljni reakcijom na mjere Vlade, ali kako vrhom liste dominiraju sjevernjaci, u usporedbi s nama usporedivim zemljama (Nova Europa - označeno zvjezdicom), stojimo vrlo dobro.
1/ 
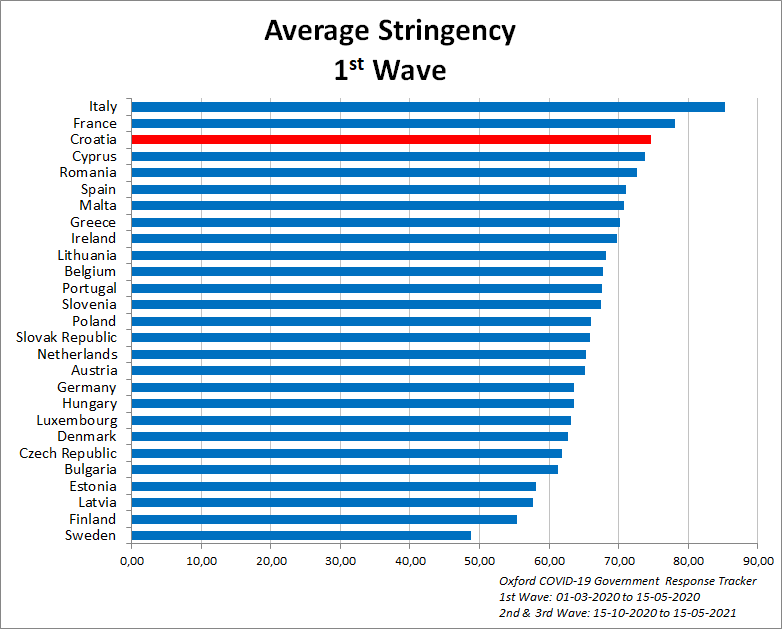
To je prvenstveno jer su Hrvati navikli na PUNO SLOBODE u ovoj pandemiji. Iako smo od jeseni imali (uvjeraljivo) jedne od najslabijih mjera u EU, nama je i to teško palo, drugi grafikon. Zamislite kako bi tek bilo da su lockdownerski znanstvenici uspjeli sprovesti svoj plan!
2/
Feb 13, 2021 5 tweets 2 min read
1/4 A curious case of Croatia
What would a normal person conclude from this?

Cases collapsed, even more having in mind radically lower posit. rate, BUT Croatia's 2nd wave stringency has consistently been among the lowest in EU

@BallouxFrancois @MLevitt_NP2013 @FrankfurtZack 
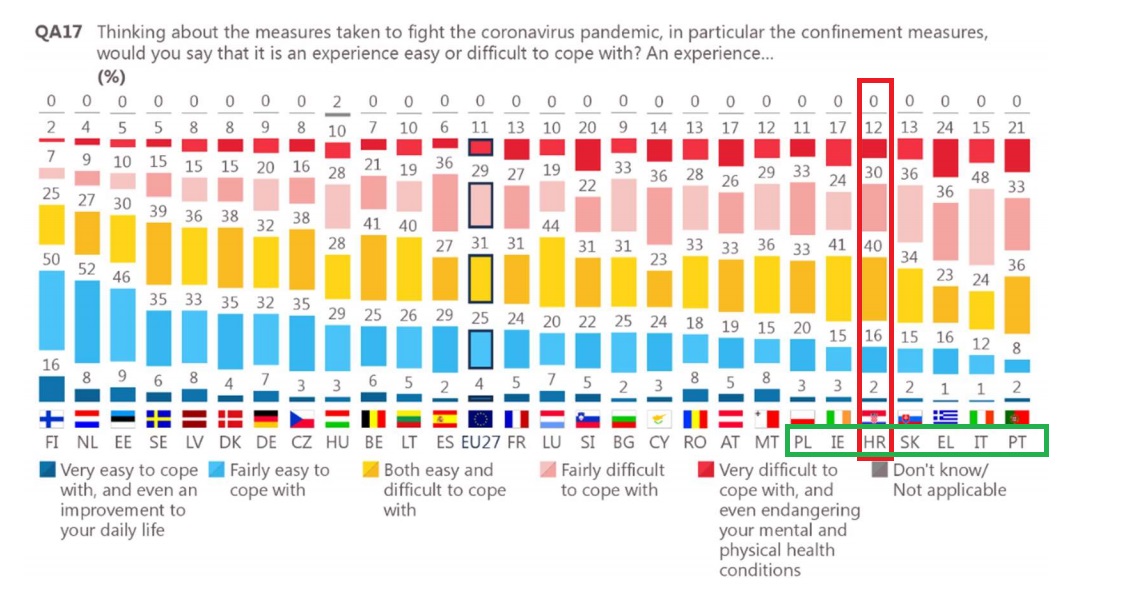
2/4 2nd wave stringency:
Feb 9, 2021 8 tweets 3 min read
An addition how Robert Koch Institute manipulated science to cause panic action

RKI is Germany's central place for all things Covid. The main paper on its extensive site is 'Epidem. profile on SARS-CoV-2 and COVID-19', a long and detailed fundam. paper
rki.de/DE/Content/Inf…
1/
You'll be suprised to find in it R0 assumed to be 2.8 - 3.8, and it used to be 3.3 to 3.8 untill 12 days ago. Now, in ten iterations, 3.8 will give you a 65 TIMES larger no. of infected than 2.5.
Imagine there is a strain 50% more infective, and you reach R =5. A catastrophy.
2/8
Jan 29, 2021 24 tweets 6 min read
Tok vode u prirodi i glupa pitanja o pandemiji - twitorial

Bakić, opet postavljaš glupa pitanja!
U 4. razredu smo na Prirodi i društvu u utorak učili 'agregatna stanja vode': voda se ledi na 0, isparava na 100. U četvrtak smo učili tok vode u prirodi: Voda iz oblaka pada kao
1/ 
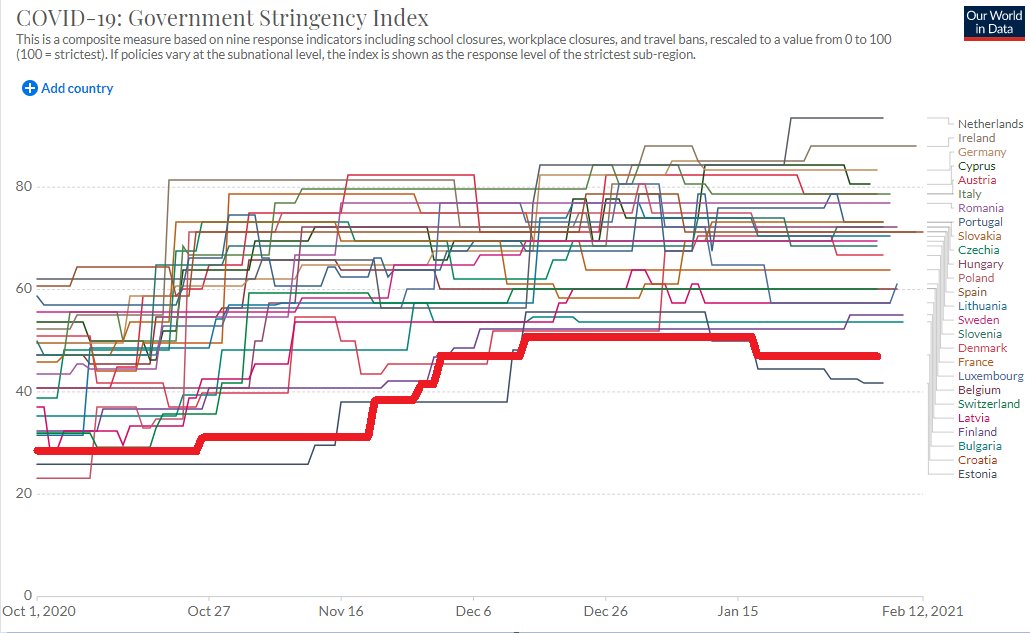
razne padaline, a onda isparava iz mora, jezera, rijeka, biljki i tla nazad u oblake.
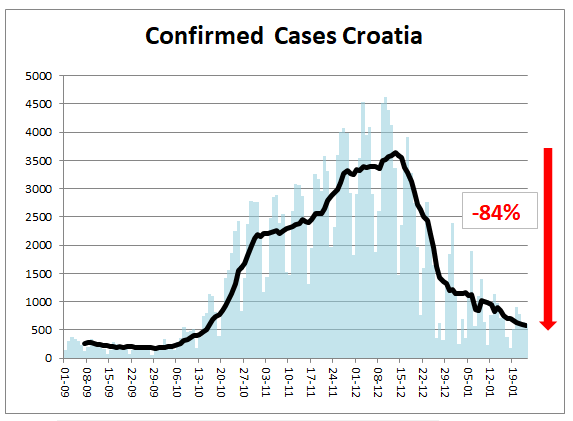
Pitao sam učiteljicu: 'Kako to da isparava, kad mora nikad nisu na 100 stupnjeva?'.
Siguran sam da se mnogi među vama sad i sami pitaju kako to?
2/
Jan 28, 2021 5 tweets 2 min read
Perhaps a solution why B.1.1.7 allegedly is more transmisible, and should push the composite R up significantly (30% if it spreads 50% faster and is 60% of all cases), BUT epidemics is deflating in UK where it is dominant
1/

@BallouxFrancois @AdamJKucharski @creon @GordanLauc R decreased in UK from some 1.2 (?) to 0.8 (?) and, anyhow in the range of 30%-40% within 2-3 weeks, and now NPIs have such power, especially since most potent ones were already implemented. In the same time it seems the % of the new strain is already decreasing.

2/
Jan 23, 2021 4 tweets 2 min read
1/ Croatia SARS-CoV-2 cases now down 84.5% from the top despite some of the least stringest measures in EU, and a series of eartquakes leading to more social interaction. Hospitals - less then 50% from the top.
First, cases:

(@BallouxFrancois @MartinKulldorff @FrankfurtZack) 2/ Stringency:
Jan 21, 2021 8 tweets 3 min read
1/

Jako dobre vijesti za sve ljude dobre volje

I dalje se nastavlja veliki pad epidemije po svim parametrima. Kako smo sada daleko ispod kapaciteta sustava, testira se puno i naravno slučajevi dobro opisuju epidemiju, ali svi parametri ukazuju na baš isto. Image 
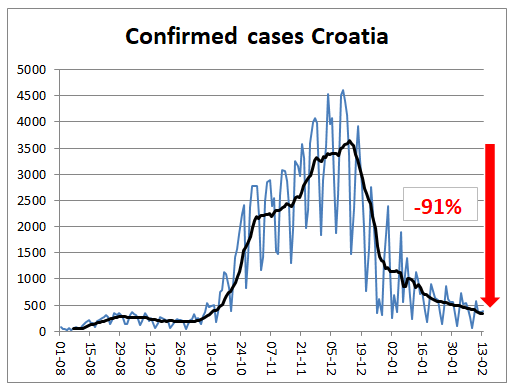
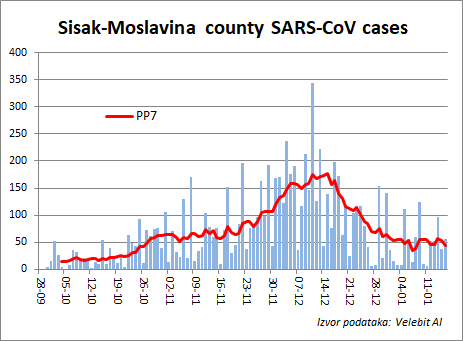
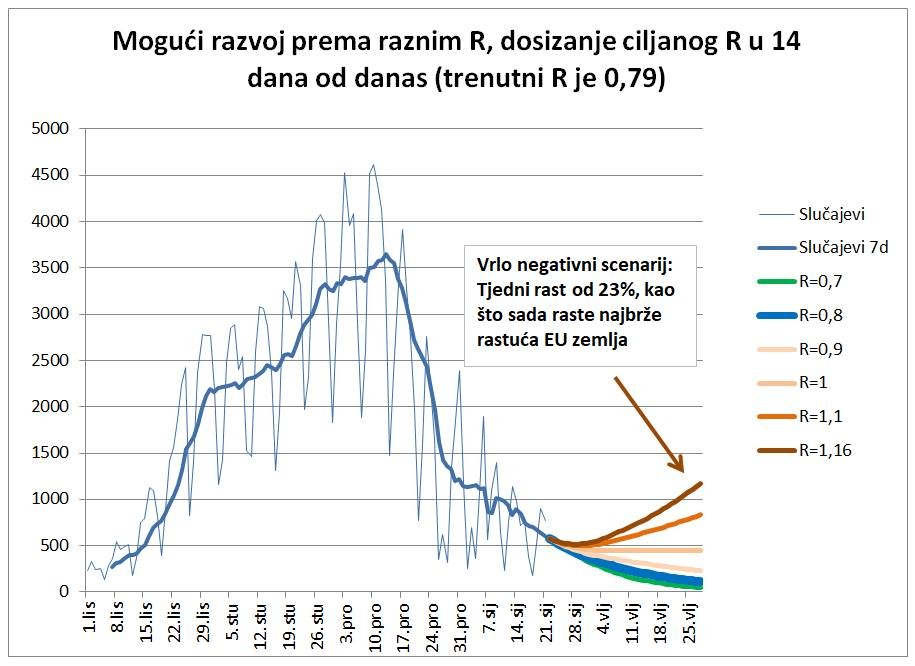
2/ Ovdje pokazujem neke parametre do de facto dolaska proljeća kad bi nas epidemija zaista trebala napustiti. Među njima sam izabrao i jedan baš jako loš, a to je da Hrvatska sad počne rasti kao najbrže rastuća zemlja EU, Portugal. Image
Jan 16, 2021 5 tweets 2 min read
An incredible, one of a kind, natural epidemiological experiment took place in Croatia.

It would be unethical to abolish all the Covid measures in a territory, but it happened in a Croatian county due to a series of eartquakes.

@BallouxFrancois @MartinKulldorff

1/ Image 
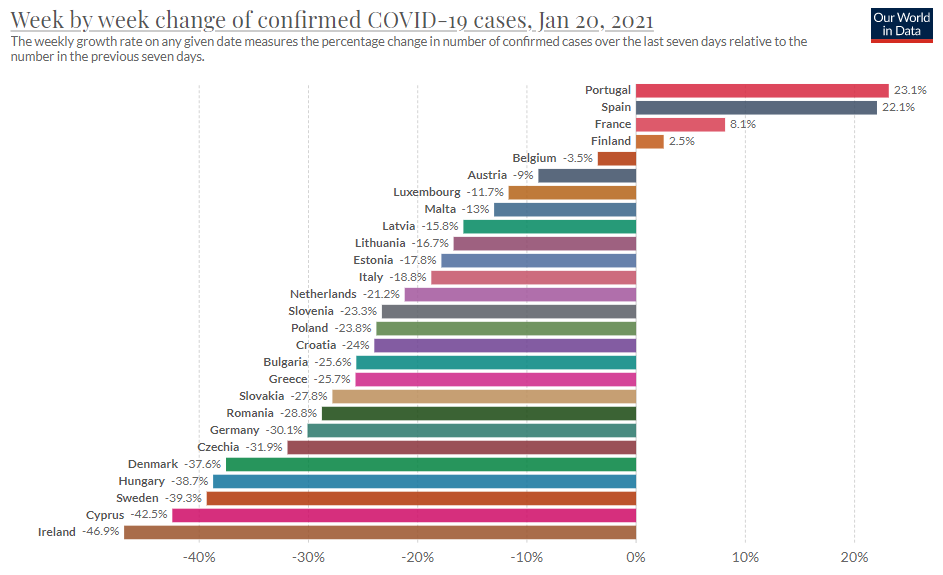
A series of lethal eartquakes, the strongest measuring 6.2 ML, claimed 7 lives and a large demage, strongly affecting some 100,000 people. Immediately, on 28th December, thousands of volunteers from accross the country converged to the affected area.

2/
Dec 26, 2020 10 tweets 5 min read
CEE countries: A case study in inevitability of SARS-CoV-2 spreading and seasonality - a THREAD

EU CEE countries did remarkably well in the 1st wave and were praised as champions. In red, and small Baltic countries in orange (we need to understand what's happening there)
1/ 
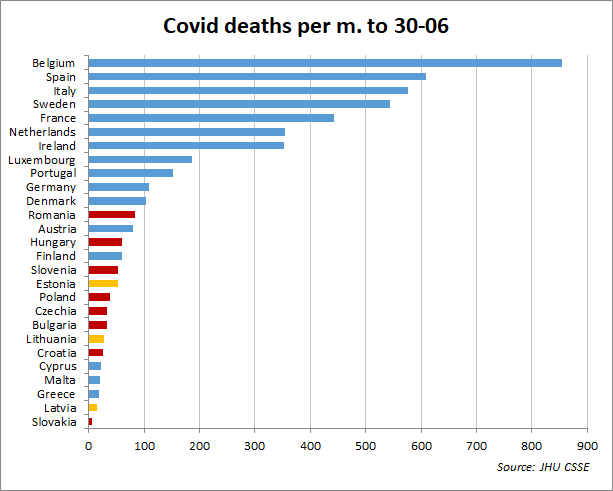
(... the analysis holds true with them, they are just marked with a different colour for clarity.)

Only one of them was in Top 13 EU countries re. deaths. BUT, in the second wave, they dominate the list

2/
Nov 4, 2020 11 tweets 7 min read
1/x Covid - Europe: The 2nd Wave collapse continutes

We continue with daily overview using JHU data (+some) looking at 'fast' weekly changes (day over the same day the prev. week) this gives us an edge in being up-to-date.

@kerpen @BallouxFrancois @boriquagato @FatEmperor 
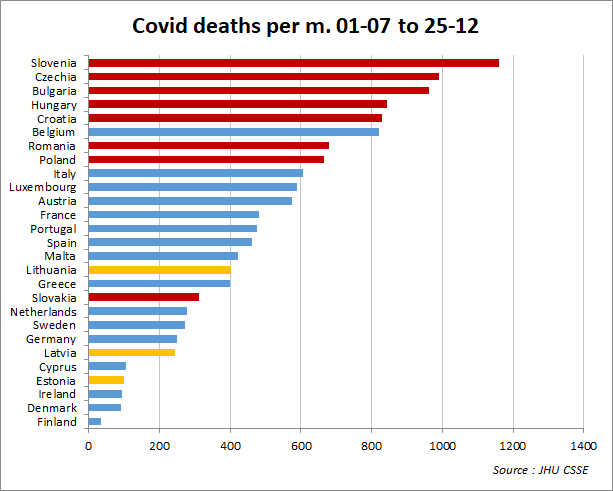
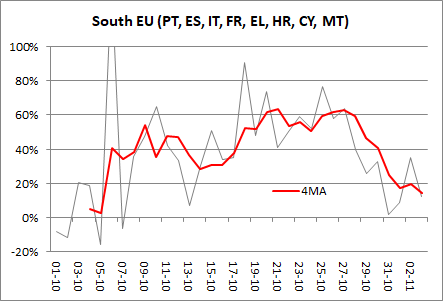
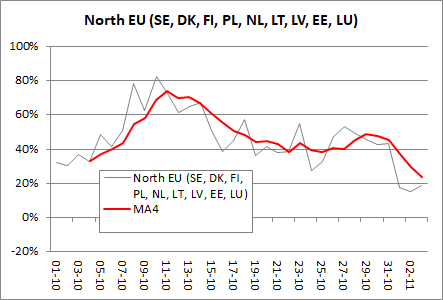
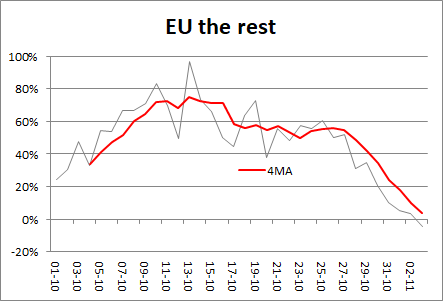
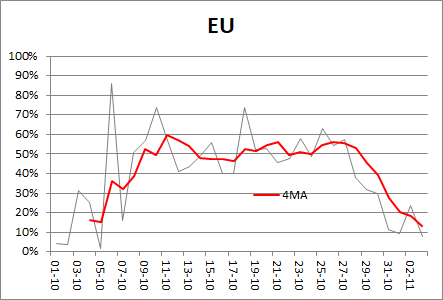
2/x Changes in weekly growth rates reflect changes in R's, thus these charts roughly represent changes in R's. Now let's see for particular countries .... but overall looking at the continent gives us a 'situational awareness' since this is like a savanah fire ....
Sep 5, 2020 4 tweets 2 min read
1/ Now REALLY interesting results from Sweden. After current infection rate at ~0% published on Thu, yesterday seroprevalence in a Stockholm district in June (related to infection prevalence beg. of June) showed 18.7% AB. Allowing for addtl. 3 mo. buildup, probably ~25% now ... 2/ ... leading to countrywide prevalence od probably at least 15% (having in mind Stockholm is big and there are some other big cities). Karolinska research found out 2/3 infected did not develop measurable AB, meaning 40% country-wide infection has been reached ....
Jul 2, 2020 9 tweets 2 min read
1/ Calling @IHME_UW to correct GIGO model for Croatia which, using wrong inputs and unclear algorithms produces ludicrous projections and compromises trust in the integritiy of the whole project
@MLevitt_NP2013 2/ The model anticipates 1500 COVID victims in Croatia by 1-10-2020, the current no. being 108. That's 14 times more. Comparison with neighb. Serbia and BiH really puzzles, projected deaths/m. being 11 and 5 times higher though the current situation is inverse, especially trends