Ohio Capital Ideas Profile picture
“The world is a hellish place and bad writing is destroying the quality of our suffering.”
Apr 7 19 tweets 15 min read
Thread on Berkshire’s acquisition record…

I’ve always been fascinated by $BRK acquisitions of entire companies, mostly because it’s a lot harder to judge performance than it is for stock market investments. It’s a lot easier to do a case study on Berkshire’s purchases of Coke, Gillette, Washington Post, AmEx, etc. because most everything you need to determine returns valuations are public.

Some years ago I started trying to analyze Berkshire’s wholly owned acquisitions for lessons learned by doing rough estimates on deal prices, revenue, PTI at acquisition (a lot of this information is actually public), estimating financials today (which by reconciling segment information in the annual report, I think is possible to come out with pretty reasonable estimate) and coming up with some rough number for how much of net income over the years was distributed back up to Berkshire – you can actually come up with some very realistic and fairly precise estimates for modified IRR, essentially the same annualized return they’d get had these been public company investments.

Thought I’d share a few of the things I’ve noticed and collected. This is probably a strange thread, but I really don’t promote anything, don’t have a Substack and thought at least some people would find this fascinating. I’ll just emphasize for the record something that’s obvious – I think these numbers are directionally pretty correct, but they are just my estimates and don’t want to make the mistake of implying any false precision. More than a few people seem to feel that Berkshire’s aggregate record at acquisitions is rather poor, but I think this is a misunderstanding based largely on the fact that most businesses that Berkshire has bought have tended to distribute most of their excess cash flows to the parent company. So, when you see a company that was bought years ago that isn’t 10x its size today the assumption is that the acquisition was a failure and Berkshire didn’t know how to manage the subsidiary when in fact the economic returns were quite good.

And planning on distributing almost all cash flows is almost certainly part and parcel of the acquisition strategy. It seems really clear to me that the playbook for a long, long time was to:

-underwrite deals at about a 10% assumed return
-have a lot of discipline on price
-only buy businesses that were thought to be durable
-and distribute 80%, 90%, or even 100% of net income to Berkshire

When I say “durable” I don’t mean in the compounder sense of businesses that can grow forever at double digits. I mean more like businesses that can stay at roughly their same size or perhaps grow at inflation rates while retaining almost none of their earnings. You buy a business at 15x after tax income, take all 90% of it every year, and the business still grows 3% to 4% and you’re going to end up with a 10% return. And I think that was basically the expectation that Buffett used when he underwrote a lot of these deals. The price question and durability questions were everything.
Mar 24, 2025 6 tweets 2 min read
I had mentioned I sold a little $BRK and that the valuation isn't extreme, but it's more richly valued than it has been in awhile. Reasonable minds can disagree, but I have Berkshire's NAV (essentially just the SOTP value) per A share at $731k with shares trading at a 7% premium. Image 
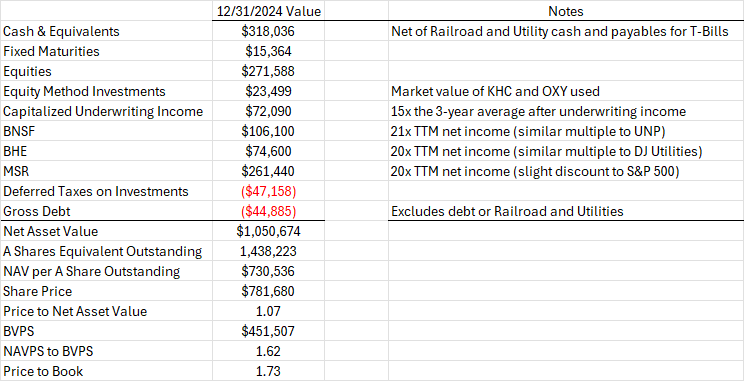
That's a little rich, though not crazy expensive, of a valuation. But, by my estimates it's the first time since 2001 that $BRK has traded at a premium to its NAV. In 2011 and again in the aftermath of the pandemic discounts got as high as more than 30%.
Feb 25, 2023 5 tweets 2 min read
Always disappointing $BRK.B doesn't provide more disclosures on the top non-insurance subsidiaries. From what is available and rough estimates, it's possible to gauge at high level how some of larger acquisitions have done. The one big piece missing is equity of each business. 
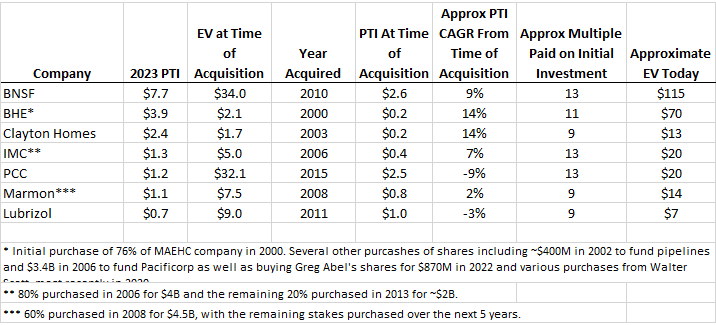
Knowing s/h equity would fill in gap on how much incremental cap was invested to achieve results over time. In case of BNSF (which reports separately), s/h equity was $46.4B at the end of last year. Pretty impressive - $5B PT incremental profit vs. $12B incremental investment.