Kathryn Huwig's 'Beyond the Data' Profile picture
COVID19 in Ohio - both the state-published data, and the real life stories that data represents. Data is from Ohio's COVID19 website: https://t.co/UCZWXGcsb4
Gary Kleeman Profile picture J Luy Profile picture 2 subscribed
Aug 5, 2022 24 tweets 5 min read
⭐️🧵 - No one can seem to find all of the new hospital admissions that the CDC is counting.

A study of the Columbus area data. When I think the absurdity must have reached its peak, I dig a little deeper and find even more impressive ridiculousness.
Jul 25, 2022 18 tweets 4 min read
🧵 - Perspective.

Is Ohio 'on fire' with COVID right now? Here we go again, the state is suddenly 'on fire' with COVID. Counties, institutions and businesses are suddenly reissuing mask mandates/advisories and panic is already ensuing.
Jun 15, 2022 23 tweets 4 min read
🧵⬇️

Let's talk about yesterday's VRBPAC meeting where they recommended authorizing M0dern@ for children from 6-17 years old. The data supporting such an authorization is scant, to say the least, and yet they still did it by playing as many games as they could.
Oct 6, 2021 17 tweets 5 min read
⭐️⭐️⭐️⭐️⭐️⭐️⭐️⭐️⭐️⭐️⭐️

🧵Because Ohio's COVID 'case' definition isn't expansive enough..

Along with yesterday's admission that cases were declining, Dr. Vanderhoff also announce a new adjustment to how we will count 'cases' going forward. First of all, Ohio has one of the most expansive 'case' definitions (if not THE most expansive) of any state. We count all PCR positives, regardless of symptoms or contact like other states. But we also count 'probables' as full 'cases'.
Oct 5, 2021 9 tweets 5 min read
🧵Well, yesterday, Dr. Vanderhoff in his press conference finally got with the program and said "We are seeing early indicators that cases appear to be peaking and beginning to point toward a decline."
.....
.....
.....

(video: tinyurl.com/3e2khvxx) I'm so glad he's so timely with that information. Although to anyone who actually looks at the data itself, it's been pretty clear for weeks now that we are declining.
Jul 7, 2021 7 tweets 2 min read
So here's a thought experiment as we watch the v-starts continue to fall with no sign of any increased interest from those who have yet to take it. It has been put out there in the new models that having 68% of people injected is a 'low' coverage number for their calculations, while 83% (for the moment) is their goal.
Jul 7, 2021 16 tweets 3 min read
I've made comments previously about how 'respectful' this virus is of our holidays both before the weekend and now after - - for those of you who haven't been following me for the long term, I think I should re-clarify what I mean by its 'respect' & why it is so important in understanding the actual danger of this virus in terms of true illness and not just people testing positive with no ill effect.
Jul 5, 2021 4 tweets 2 min read
It's a bit of a short bit of (mis)information today since cases aren't reported on holidays, but V information never takes a break! So here you go, today's V data, telling us the same story of those who want it, have taken it, and those that don't are not convinced. Image I have also added a bonus graph today - one showing v-starts by reported date (blue line) and v-starts by assigned date (orange line). I haven't taken the time to actually analyze the area under the curve, but - Image
Jul 2, 2021 9 tweets 3 min read
So some really fascinating misinformation today - we've had a huge 'jump' in newly reported cases! Nearly TRIPLED! Everybody panic!! And they're nearly all confirmed cases! Double panic!
Must be that new Delta variant, right?
Or maybe the brand new 4th of July variant? But the media tells us it must be bad!
(vindy.com/.../daily-covi…)
Jul 2, 2021 11 tweets 3 min read
We've recently heard about how it's the unV'd that are now testing positive in the hospital, with a scary % given to us. But what does it mean? How many are there in the hospital? And how do we get a good perspective on it?

Well, good news, I've become a data hoarder. Attached, please find direct comparisons of how many COVID+ patients are/were in the hospital, how many non-COVID patients and how many empty beds there were for each of the eight regions (map showing what each region is is also attached).
Jul 1, 2021 5 tweets 2 min read
Sliding downwards to 165 total cases per day for the whole state over the last 14 days.

1.87 total cases per county per day. We are now at 96 confirmed cases per day over the last 7 days, just 1.09 cases per county per day.
Jun 30, 2021 6 tweets 2 min read
Tuesday's new reported data again shows a bump in the near term probables. Right on time with the beginning of the work week. Purely coincidental, I'm sure.

We are now down to just 167 total cases per day for the whole state, just 1.90 total cases per county per day. Image Confirmed cases in the last 7 days have also dropped to their lowest point, with just 98 confirmed cases per day.

⭐️ That's 1.11 cases per county per day. Image
Jun 29, 2021 7 tweets 2 min read
14 day cases continue to be down and we've switched back to day over day decreases in the 7 day case numbers, though we haven't returned to our lowest numbers again. Image We are now looking at 170 total cases in the entire state per day, which equates to 1.93 cases per county per day over the last 2 weeks
Jun 18, 2021 5 tweets 2 min read
We are now down to 225 total cases per day over 14 days, or just 2.56 cases per county per day.

When we get down to confirmed cases over a week's span, we're down to just 119 cases per day, or 1.35 cases per county per day.
Jun 18, 2021 21 tweets 4 min read
Apologies upfront for the complexity of this post today, but the delaying of the 'emergency' meeting regarding myocarditis in younger individuals is beyond shocking and irresponsible. In this post I have attached my commentary directly to each of these images, please read each and consider them carefully.
Jun 17, 2021 8 tweets 2 min read
Cases, of course, continue to fall, with ~239 total cases reported per day over the last 14 days, which equates to just 2.71 cases per county per day. Image 
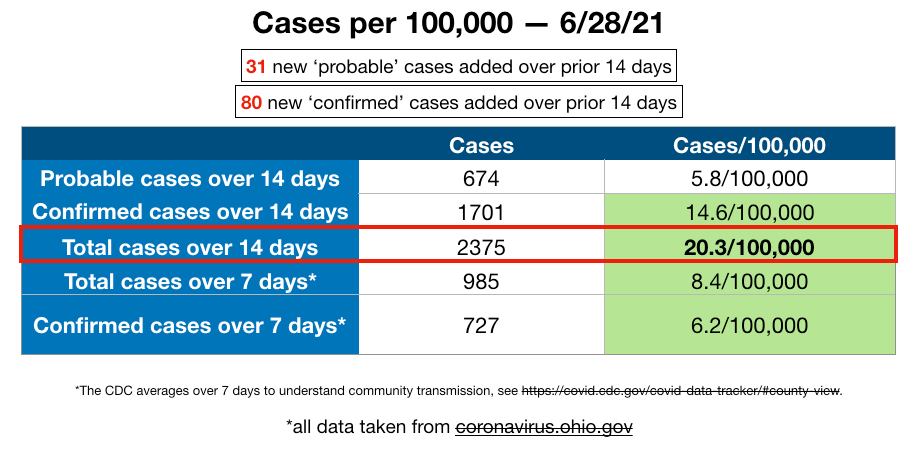
We're down to just 878 confirmed cases over the last 7 days - which equates to just 125 cases **for the whole state** per day, and 1.42 confirmed cases per county per day. Image
Jun 17, 2021 5 tweets 2 min read
We have now dropped to just 914 confirmed cases over the last 7 days. That's 130 cases per day. 1.48 cases per county per day. If we go with total numbers over 14 days, we're at 2.9 cases per county per day. Image Our percentage of 'probable' cases has continued to remain high. As a reminder to those who critique my focus on the ridiculousness of continuing to count 'probables' as full cases, I direct their attention to fda.gov/medical-device… Image
Jun 6, 2021 11 tweets 3 min read
So here we are - as of June 5th we have officially dropped below the magical 50 cases/100,000 metric that Gov. DeWine set for us on March 4th. Once this goal was met, we were told, ALL health orders were to be removed. Please watch the attached video to hear it yourself how explicit he is.

Jun 6, 2021 5 tweets 2 min read
🎉🎉🎉🎉🎉🎉
Congratulations, everyone!
🎉🎉🎉🎉🎉🎉 Right on schedule! Almost as if they could calculate it from the epidemiological curve and that minor matter of dropping test volume by over half in the last 6 weeks. But there's NO RELATIONSHIP. Promise!
Jun 5, 2021 5 tweets 2 min read
Cases over 2 weeks continue to drop, but there's been a recent small uptick in cases in the last 7 days, both probable and confirmed. Probables as a percentage of total new reported cases continues to be pretty high as it has been over the last few days.
Jun 4, 2021 4 tweets 2 min read
Part 2

This part is all about the Big V. I figured I'd start this one with a fascinating little dance performed by Gov. DeWine yesterday morning as he tries to sugarcoat and twist, and excuse the epically low V numbers.

So let's take him at his word, and give him a couple days for the numbers to settle out, shall we? Though just looking at our V-stats, I don't think there's much hope that we're looking at just reporting lag anymore.... Image