
Formerly Better Trader Academy. The home of "Mr Breakouts". Algo Breakout Trading Specialists. Follow for tips and strategies on algorithmic breakout trading.
 Full walkthrough with live demo:
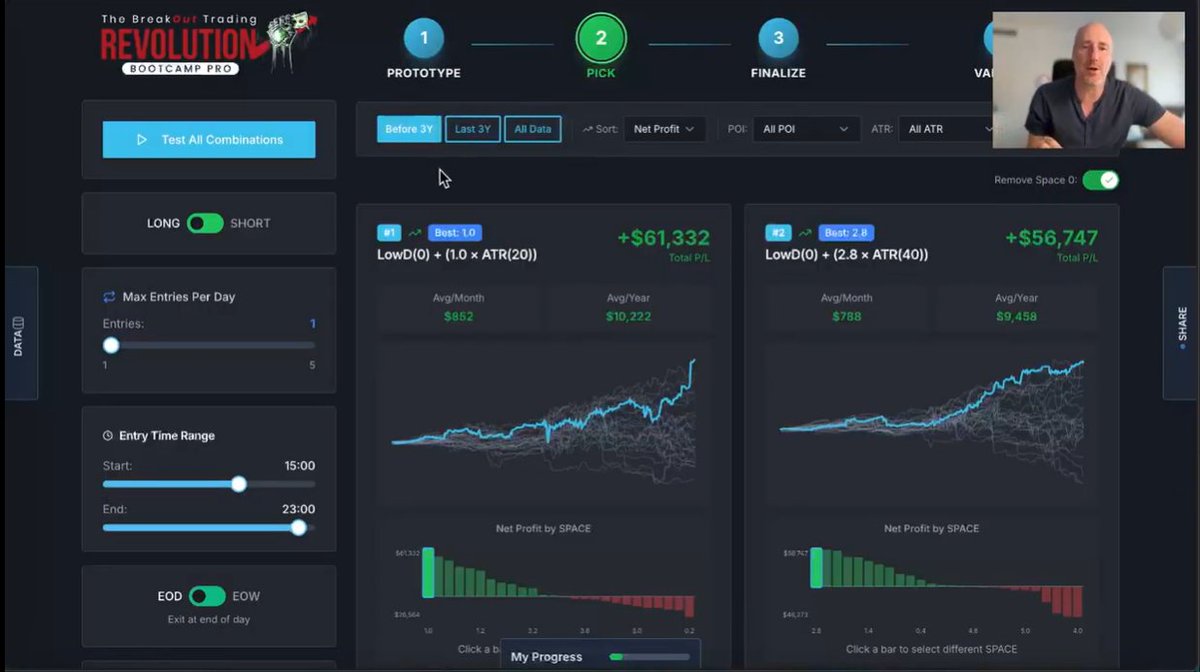 In the video, I show how I build simple foundational breakout models.
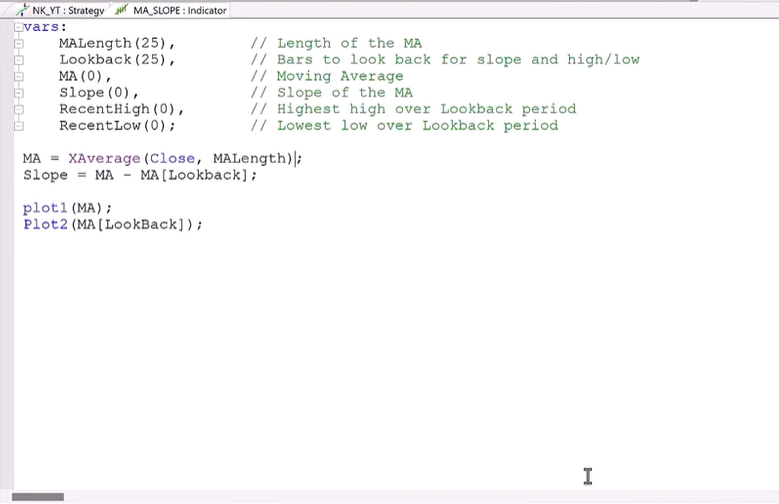 Full demo of how I turned the slope filter into a real Nasdaq weapon.
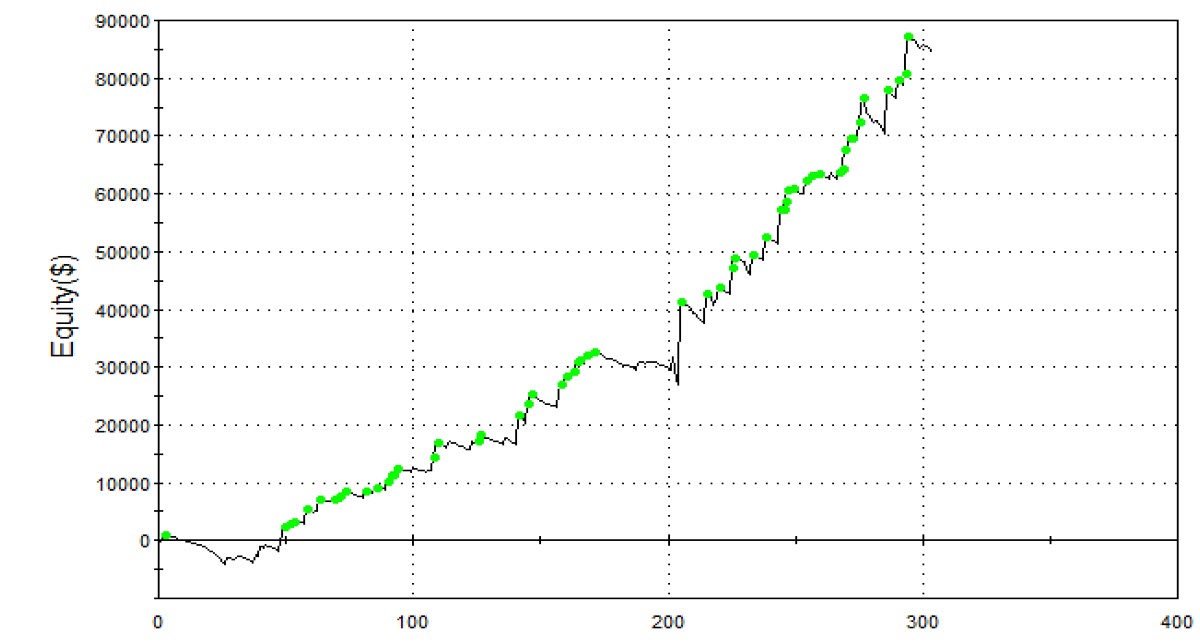
 This video walks you through our ADX research.
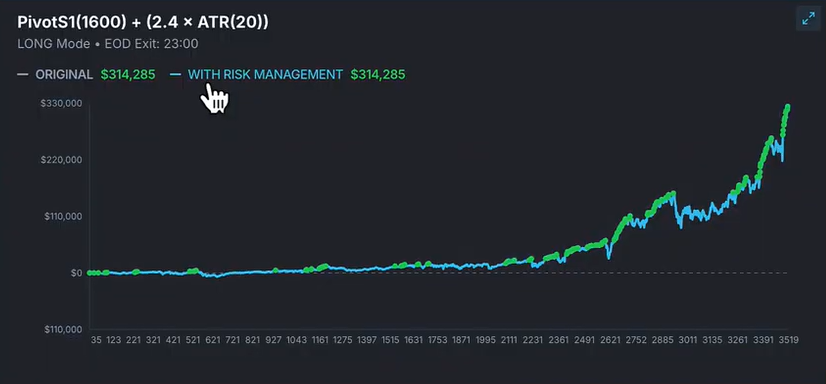
 Here’s the video where I break everything down how we use ATR to structure entries, filter out noise, and manage exits with real volatility logic.