Paula Surridge Profile picture
Deputy Director @ukandeu, Political Sociologist @spaisbristol Interested in political values, public opinion, elections, class and education.
Apr 16, 2023 9 tweets 3 min read
Apparently there are local elections coming up so here are a few words of warning about assuming these are a good test of the public mood for general election. /1 Last year I analysed voters who turnedout at the GE and not at local elections a year later. This shows that precisely those voters most likely to swing a GE are those least likely to turn out at locals. Weak or no party identity and low(er) political interest. /2 Image
May 5, 2022 7 tweets 3 min read
New blog from me, using data from @RedfieldWilton on how leave and remain voters view the impact of Brexit on the cost of living.

ukandeu.ac.uk/the-evidence-s… Brexit as an issue has fallen out of the public eye - it was 11th (out of 11) issues in the @Ipsos issues index for April but the cost of living is top of the list. Do voters connect them?

ipsos.com/en-uk/issues-i…
Apr 25, 2022 4 tweets 2 min read
My piece on why you should read local election results with care /1 We don't have good data on local election turnout per se but using the @BESResearch panel I've looked at the group who voted at the 2019 general election but who did not do so in the 2018 locals
Oct 21, 2021 5 tweets 2 min read
#BSA38 released by @natcen today. Worth remembering that the data are from summer 2020 so still quite early on in the pandemic. Overall there doesn't seem to be radical shifts in values but given how early it is there are hints that things might change. 1/ This chart on redistribution shows a marked increase between 2019 and 2020 in % agreeing we'll need more data points to know if it is noise in the data (which does occur year to year) or part of trend 2/
Sep 24, 2021 4 tweets 2 min read
A bit more on the voting/non-voting values divide. First chart for those with GCSE as highest qualification.

For all but 70+ group non-voters are more authoritarian than voters. For the youngest group they are also considerable less economically 'left'. For those with a degree or higher the pattern is more marked. Non-voters with degrees more authoritarian than voters with degrees.
Aug 27, 2021 4 tweets 1 min read
Looking at voters who switched from Labour to Conservative either in 2017 or 2019, compared with other Con and Lab voters. All data from BES internet panel

56% of those who switched self-identify as working class (36% of Cons and 49% of Lab) /1 A third of 'switchers' think neither party looks after their local area (compared with 21% Cons and 15% Lab)

I think this is an important factor - and need to better understand the difference people draw between someone who stands up for them/their area and regional devo /2
May 11, 2021 14 tweets 4 min read
Class, values and voting - a thread ⬇️

Some debate today about how we should think about social class. Been a topic for the last 40 years in political sociology, not going to be resolved on twitter but for Labour it doesn’t really matter... /1 ...as however you think of ‘working class’ Labour are losing in that group. The key to unlocking this (as shown in the thread) is thinking about economic and social values (which have their roots in social positions) and how people engage with these as identities.

/2
May 11, 2021 5 tweets 2 min read
Will get into definitions of class later - here is occupational class by values group from the @BESResearch random probability survey

The key point to take away:

Among both higher professionals and routine occupation groups more than 60% are on the 'left' BUT For higher professional this is 35% Liberal, 17% moderate and 8% 'authoritarian'
For routine occupations this is 8% Liberal, 21% moderate and 31% authoritarian.

This is the challenge if you want to unite the 'left'
May 11, 2021 5 tweets 2 min read
A snippet from the Rotherham Borough Council vote validation via rotherham.gov.uk/elections-voti… We are reading so much into what 'Red Wall' and other voters think from the votes of < 1/3rd of voters who are far from a random sample of voters in a given area.

It is information to use, but it is a long way from perfect information and should be used with caution.
Feb 26, 2020 6 tweets 2 min read
A short thread on my piece (behind paywall) here:

journals.sagepub.com/doi/full/10.11…

I look at groups of seats either lost or gained by Labour in 10 or 15 vs those lost or gained in 17 or 19 to set up a comparison pre Brexit and Corbyn and post-Brexit and Corbyn. First, evidence on EU referendum vote. Seats lost in 2010 or 2015 are as 'leave' voting as those lost in 17 or 19
Feb 4, 2020 5 tweets 2 min read
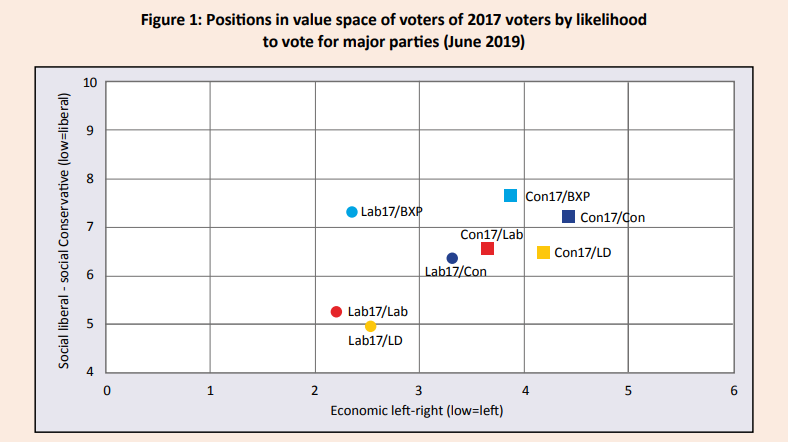
My piece from @UKandEU report out today shows the value positions of voters for Labour and Conservatives in 2017 by the parties they were likely to vote for in June 2019 1/n Some key points:

The divide between Lab17/Lab and Lab17/LD vs Lab17 and Brexit Party is well known now and a challenge for Labour to unite those voters 2/n
Jan 13, 2020 4 tweets 1 min read
Something even more long-term to illustrate how the Labour vote has changed. Between 92 and 2010 the Labour voters were in roughly the same average position on social liberalism scale (scales run -2 - +2 low is lib and left) more or less in the centre of the scale (at 0) 1/3 They moved on average to a more liberal position in 2015 (as they gained liberal voters from LDs and lost socially Conservative voters to UKIP). This was further compounded in 2017. 2/3
Mar 27, 2019 4 tweets 1 min read
Wow, the latest @yougov poll has don't know running at more than 1 in 5 of pretty much every socio-demographic grouping and all previous votes. There is huge volatility in the system which may or may not be realised by the 'other' parties. Some other note worthy figures: Among remainers 'Other party' (Not Lab/Cons/LD or SNP) is only at 6% but 2/3rds of these give Green as the other party. Among leavers 15% are saying 'other' party and Brexit party is polling higher than UKIP (perhaps confirming my hunch Farage brand > UKIP brand)
Mar 10, 2019 4 tweets 2 min read
Unpacking age and education effects on values using the British Social Attitudes 2017 data.

Neither age nor education make much difference to how 'left-wing' someone is (on economics) And there is also no evidence of the young being especially 'pro-welfare'. Those *with* degrees (or current students) are more pro-welfare than those without degrees (this effect seems a little weaker in younger age groups).