R for the Rest of Us Profile picture
You don’t need a PhD in statistics or years of coding experience to learn R, the most powerful tool for data analysis and visualization. Made by @dgkeyes.
Sep 15, 2022 7 tweets 3 min read
In our consulting work, we make a lot of donut charts that look like this. We do it so often that I decided to make an #rstats function to create them. Here's a thread on how I did it. 
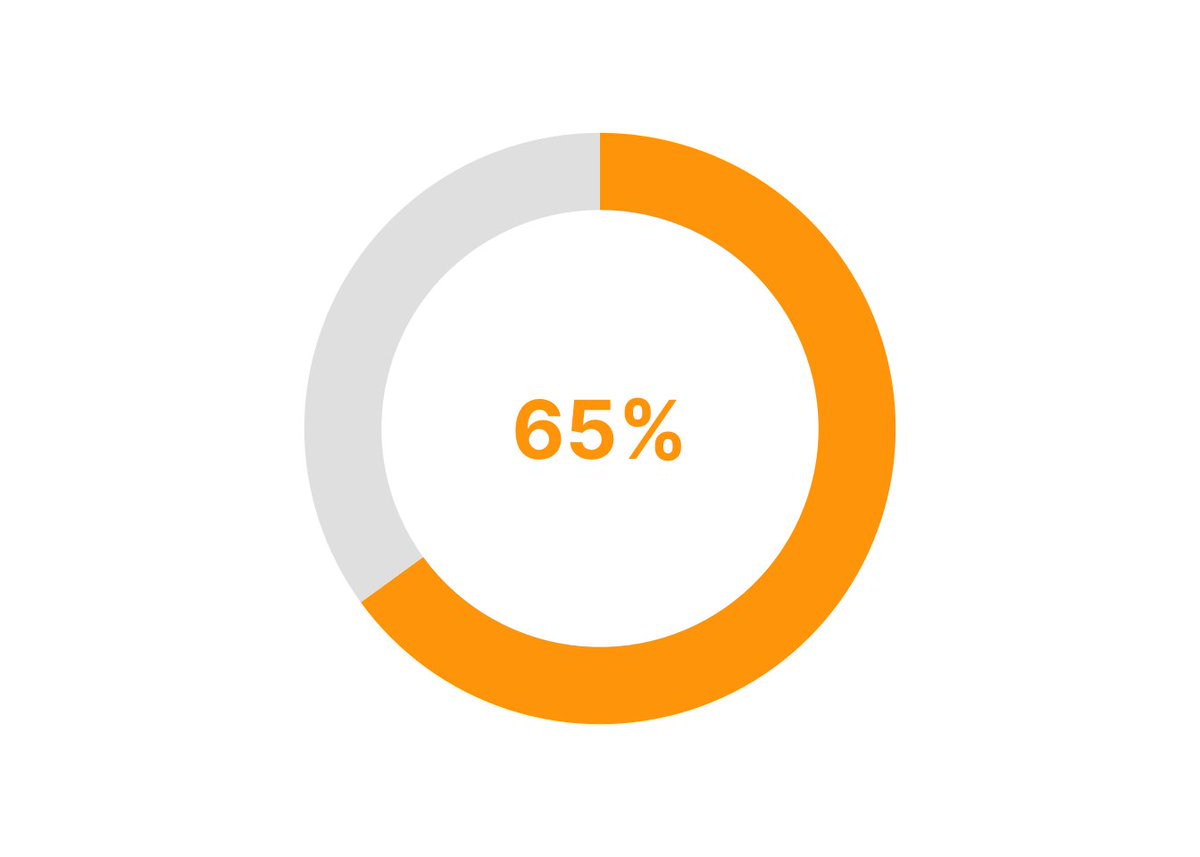
Let's first get straight to the code to make a donut chart with a big number in the middle. Code to make donut chart. See full code at https://rforthere
Apr 18, 2022 24 tweets 8 min read
The {bookdown} package is a great way to publish an #rstats book online. It's what I'm using to make R Without Statistics.

Here's a thread with step-by-step video instructions to help you get started with {bookdown}.

Prefer a blog post? Check out rfor.us/bookdown. Screenshot of R Without Statistics 
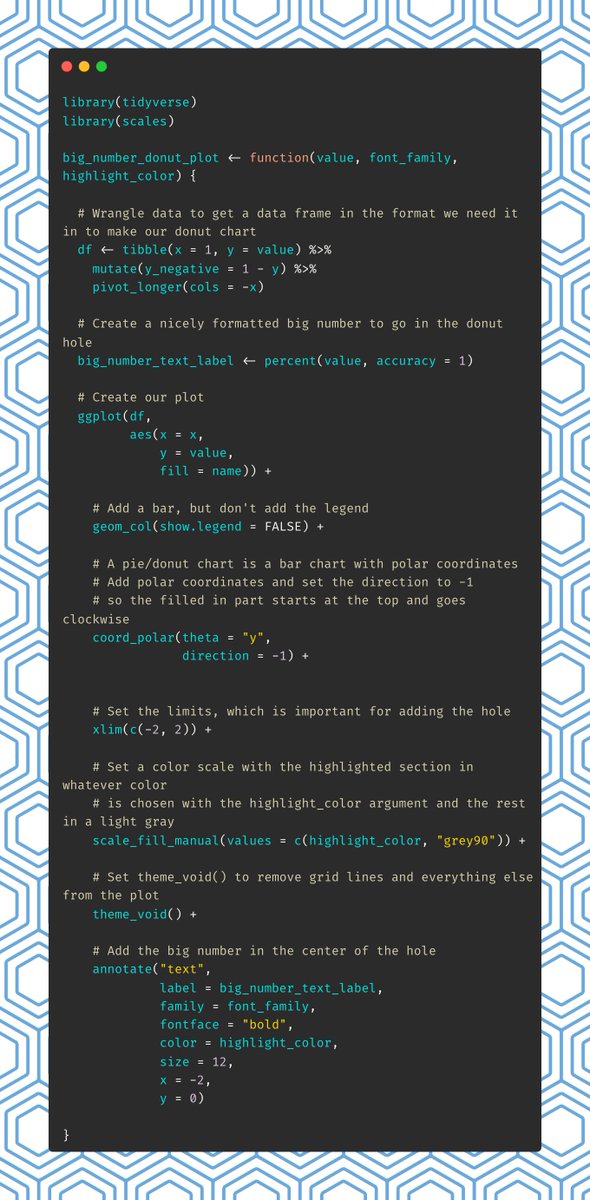
First, you'll want to install bookdown, same as any other package.
Feb 16, 2021 25 tweets 9 min read
Setting up Git/GitHub to work with R/RStudio can be challenging.

Here's a thread to walk you through the process step by step.

This thread also lives in blog post form. #rstats

rfortherestofus.com/2021/02/how-to… Preamble: the best overall resource, and one I rely on extensively, is Happy Git with R by @JennyBryan and @jimhester_.

If you have additional questions about Git/GitHub + R/RStudio, this should be your first destination.

happygitwithr.com
Dec 11, 2019 14 tweets 8 min read
Got messy data? There are many ways that R can help you clean it. Here are a few ideas. #rstats

rfortherestofus.com/2019/12/how-to… Educate people providing you data on how you'd like it to be organized.

The article Data Organization in Spreadsheets by @kwbroman and @kara_woo is a great resource to share.
tandfonline.com/doi/full/10.10…