Ryan Panchadsaram Profile picture
How can we make things better than we found them? Our planet, our communities, our tools. Let's move with @SpeedandScale 🚀
Potato Of Reason Profile picture 1 subscribed
Dec 18, 2020 7 tweets 7 min read
Yes! 🚨🚨🚨

Just now, HHS/CDC/ASPR released their internal docs capturing how this crisis looks.

This is the most comprehensive national data on how this virus is affecting our communities: States/CBSA/Counties. Cases. Tests. Positivity. It's all there.

healthdata.gov/blog/covid-19-… THESE REPORTS WILL BE RELEASED DAILY.

Right now, millions of people must make informed decisions.

What’s unique about these reports is they begin to connect the DATA with the GUIDANCE.

And it is the *federal government* doing it.
Dec 3, 2020 18 tweets 10 min read
1/18 - As we battle COVID, we’ve got to be clear-eyed about the bigger threat to humanity: our emissions crisis.

To zero out the 55 gigatons we emit yearly, we must deploy the technologies we have & invest in the ones we need.

Let's dig in...

rypan.medium.com/zero-emission-… 2/18 - This talk was part of the @EnvDefenseFund Climate Tech Series.

@NatKeohane & @AVLeland asked: What was COVID’s impact on cleantech investing in 2020?

This thread will cover the highlights. See the deck & video for the full briefing.
Nov 5, 2020 5 tweets 3 min read
1/5 - As the electoral map comes to view, it's clear that our country is divided on how it is approaching and tackling COVID.

Whoever leads our country will have to face the seriousness of how much this virus is spreading and unify our response.

Takeaways on the key metrics... 
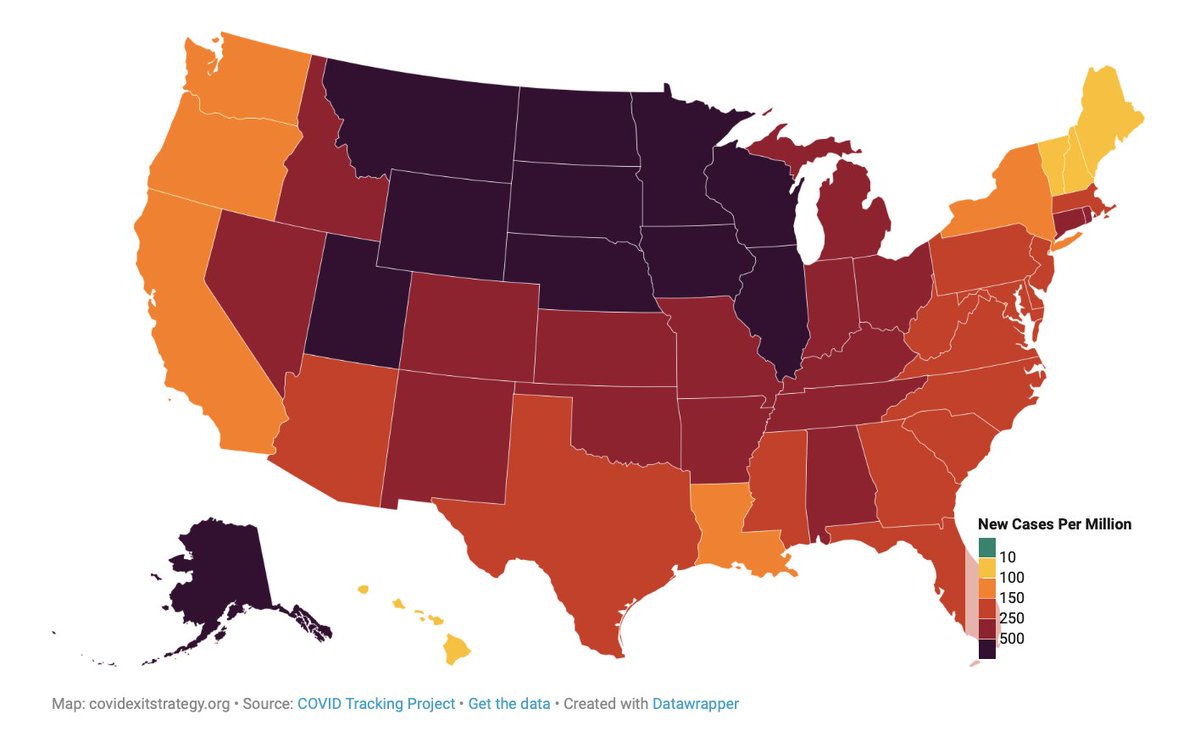
2/5 - **Cases Per Million Per Day**

- Biden: 14 of 20 are below 250 cases
- Trump: 7 of 25 are below 250 cases

- Biden: 2 states are higher than 500 cases
- Trump: 8 states are higher than 500 cases

Across the board, hospitalizations are going up in pretty much every state.
Aug 11, 2020 15 tweets 7 min read
1/ I hate being a broken record, I promise to stop once all COVID-response data is made public. Specifically the data-rich reports from the WH COVID Task Force & aggregated data from the HHS Protect System.

Without these data we're flying blind, I'll share why with 3 examples ⤵️ 2/ So far, two of the weekly reports have been leaked. The first on 7/16 by @publicintegrity & the second on 7/28 by @nytimes. It appears the distribution of these reports has been restricted, so no full leaks since then.

Just an hour ago a partial leak:
fox8live.com/2020/08/11/whi…
Jul 21, 2020 11 tweets 8 min read
1/ The data is back! @HHSGov is refreshing ICU & bed counts using its new HHS Protect System.

We've refreshed: covidexitstrategy.org

The past week has sounded the 🚨🚨🚨 that we need an "Operation Warp Speed" for data.

Reliable & realtime data is a critical intervention. Image 
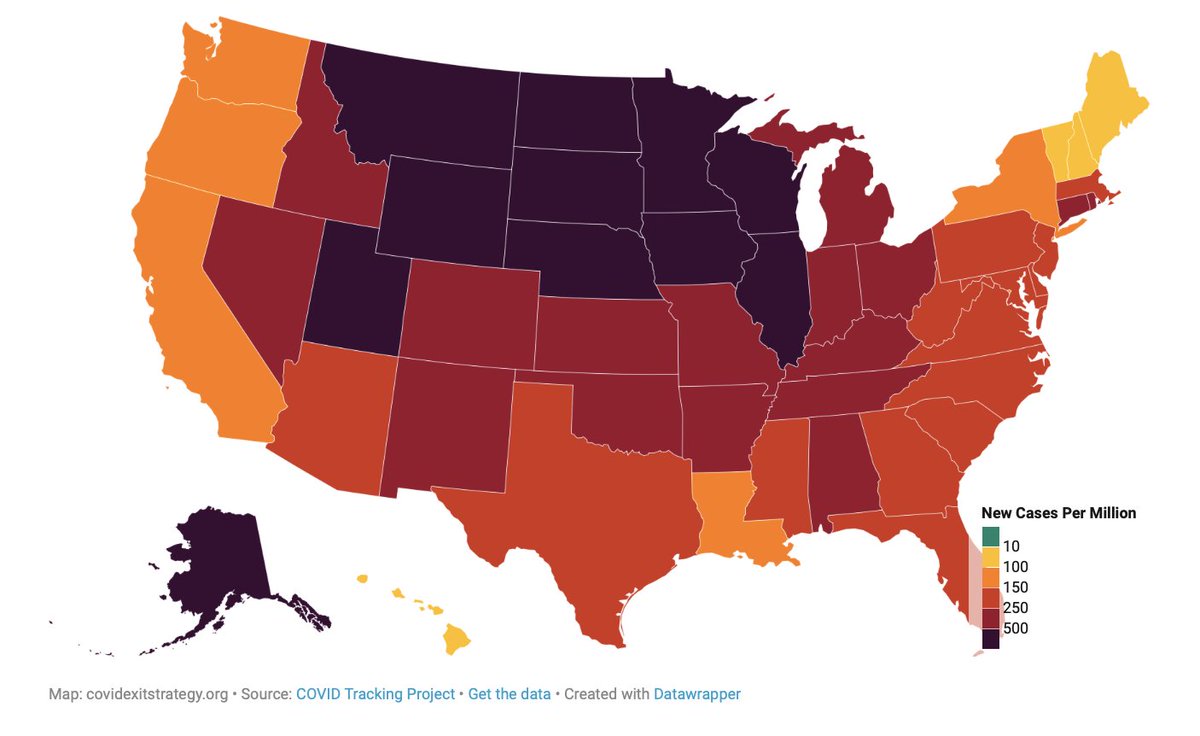
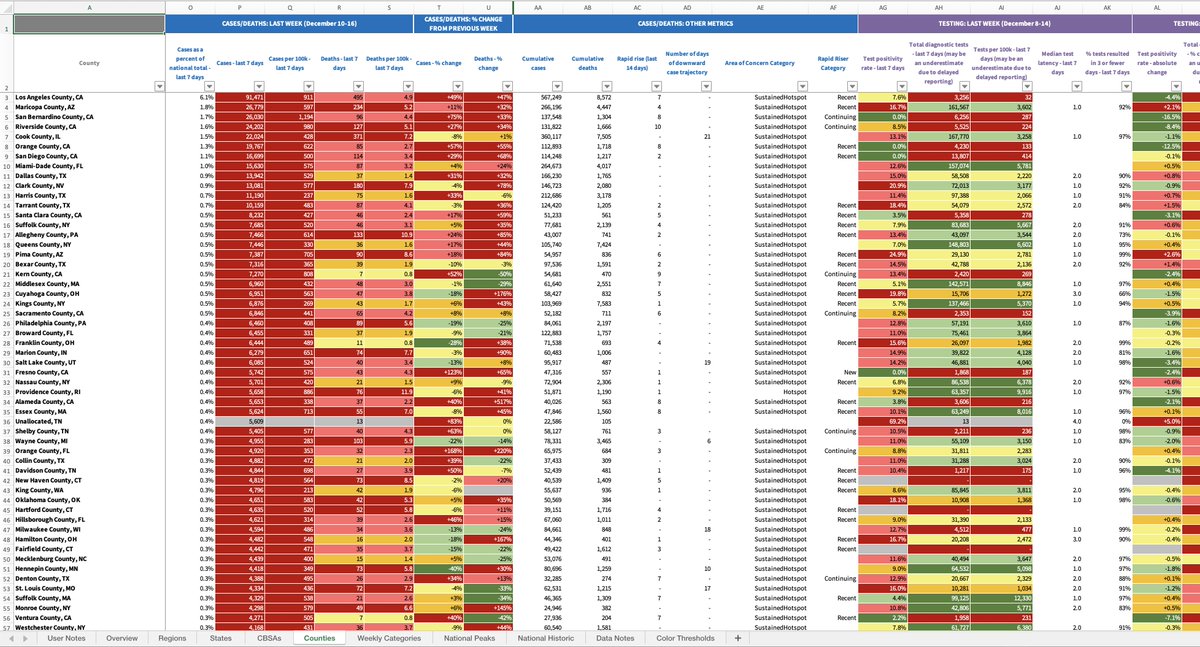
2/ The team at @HHSGov has a new system called HHS Protect that is bringing together "200 disparate data sources...into one ecosystem that integrates data across federal, state, and local governments and the healthcare industry."

protect-public.hhs.gov
Jul 13, 2020 7 tweets 3 min read
1/ Be *ALERT* when you see rising case numbers, but be *ALARMED* when POSITIVITY is high.

As testing throughput increases the number to focus on is the test positive rate: [# COVID POSITIVE] / [TOTAL TESTS].

If POSITIVITY is high & increasing, you have no excuse but to ACT. 
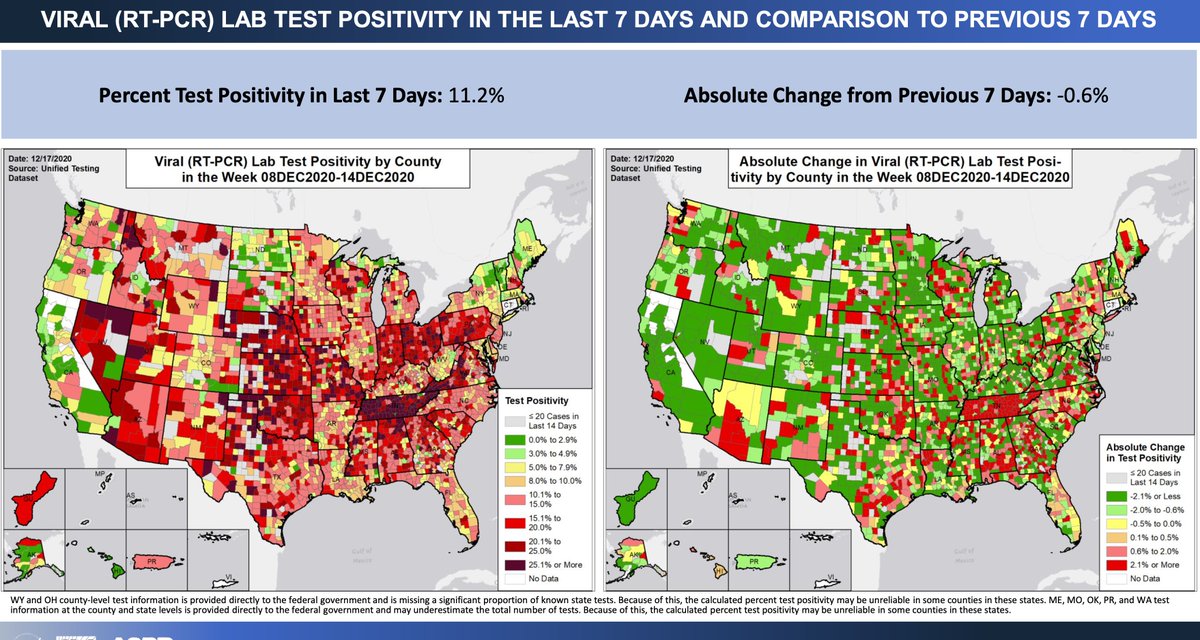
2/ There's a talking point going around which says: "as you test more, of course, you'll find more cases".

That's not true. A state that has the virus in retreat will find fewer cases overall as it tests more.

That's when POSITIVITY % is low & decreasing.
Jul 11, 2020 11 tweets 5 min read
1/ If we are at war with this virus, we need to push away partisanship and attack it with the interventions that work.

**Things are getting worse.**

We just updated covidexitstrategy.org and added a new color, "Bruised Red" to capture the new extremes that we are seeing. 2/ Our deeper red captures the new highs. States where CASES PER MILLION are more than 150 per day; where POSITIVITY is higher than 10%, & ICU OCCUPANCY is higher than 85%.

By focusing on CASES PER MILLION & POSITIVITY we are more accurately presenting the situation.🍎s to 🍎s
May 21, 2020 12 tweets 8 min read
1/ We can #OpenSafely.

Together with @USofCare, @ResolveTSL, @DukeMargolis, and @USDResponse we've been tracking how states are progressing on key measures: (1) disease spread, (2) impact on health system & (3) testing robustness

covidexitstrategy.org

What have we learned? 2/ **We are only as good as the data that is publicly available**

We rely on @COVID19Tracking, rt.live, and @CDCgov. Two are volunteer efforts and one is a government agency.

We need our @CDCgov to publish real-time, machine-readable data like the others do.
Mar 19, 2020 10 tweets 5 min read
We can't turn people away from tests as capacity is ramping up. The @CDCgov and/or public health officials should be creating "waitlists" so people can be followed up immediately when tests are made available in their area or via mail. 2/ To date, in the United States 82,571 tests have been performed...22,410 tests were done between Tuesday and Wednesday. You can see the progress our country makes each day at @COVID19Tracking and covidtracking.com/us-daily/. We double our ability to test every few days.