Group Chief Economist and MD @Afreximbank. Was Partner & Chief Economist, KPMG West Africa & Statistician General/CEO @nbs_nigeria. All views personal


 After covid money supply grew at similar pace as GDP but inflation kept surging despite adopting arguably the most intense monetary tightening in the world to combat inflation.MPR rose by almost 100%, CRR from 15% to over 35%, Asymmetric corridor widened & Intense Fx demand 2/6


 Less of the economic gain is coming from the middle phase which is the actual production itself we always focus on. (smile curve theory). Where does this leave us Re our growth& development strategy going forward? What lessons should we learn now as the World keeps evolving? 2/3

 Q3 2020 GDP report published @ nigerianstat.gov.ng/download/ 1191

 Q2 2020 GDP report published @ nigerianstat.gov.ng/download/1191.
 Q2 2020 GDP report published @ nigerianstat.gov.ng/download/1191.

 Oil GDP contracted by -13.89% (-6.63% in Q2 2020; 6.49%% in Q3 2019).


 Half year 2020 States Internally Generated Revenue Report published @ nigerianstat.gov.ng/download/1167:


 Q2 2020 GDP report published @ nigerianstat.gov.ng/download/1143.


 Q2 2020 Unemployment/Underemployment report published @ nigerianstat.gov.ng/download/1135: Unemployment by age 1/2


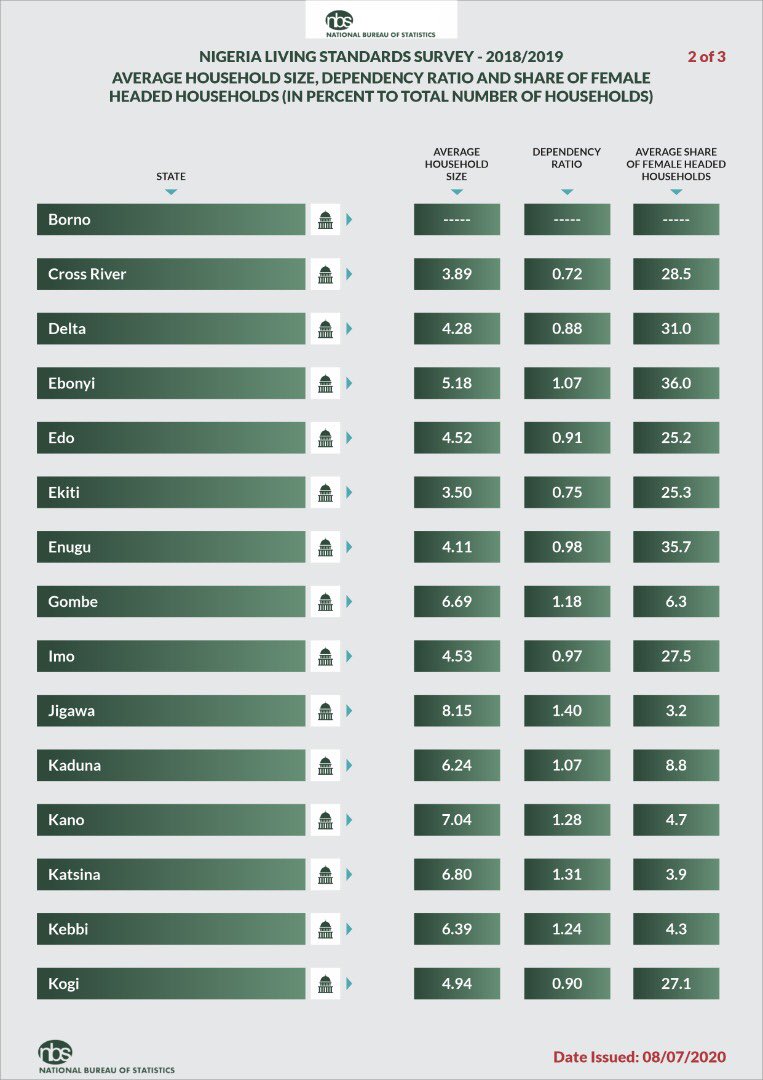
 2018-19 National Living Survey Published @ nigerianstat.gov.ng/download/1123: SELECTED INFOGRAPHICS(see full report for more details as shown in table of content)- Average household size, dependency ratio, share of female headed households


 Q1 2020 Foreign Trade in Goods report published nigerianstat.gov.ng/download/1112. Q1 2020 Total Trade at N8.30t compared to N10.12t in Q4 2020 & N8.24t in Q1 2019. Exports at N4.08t (N4.77t in Q4 2019 & N4.54t in Q1 2019). Imports at N4.22t (N5.35t in Q4 2019 & N3.70t in Q1 2019).


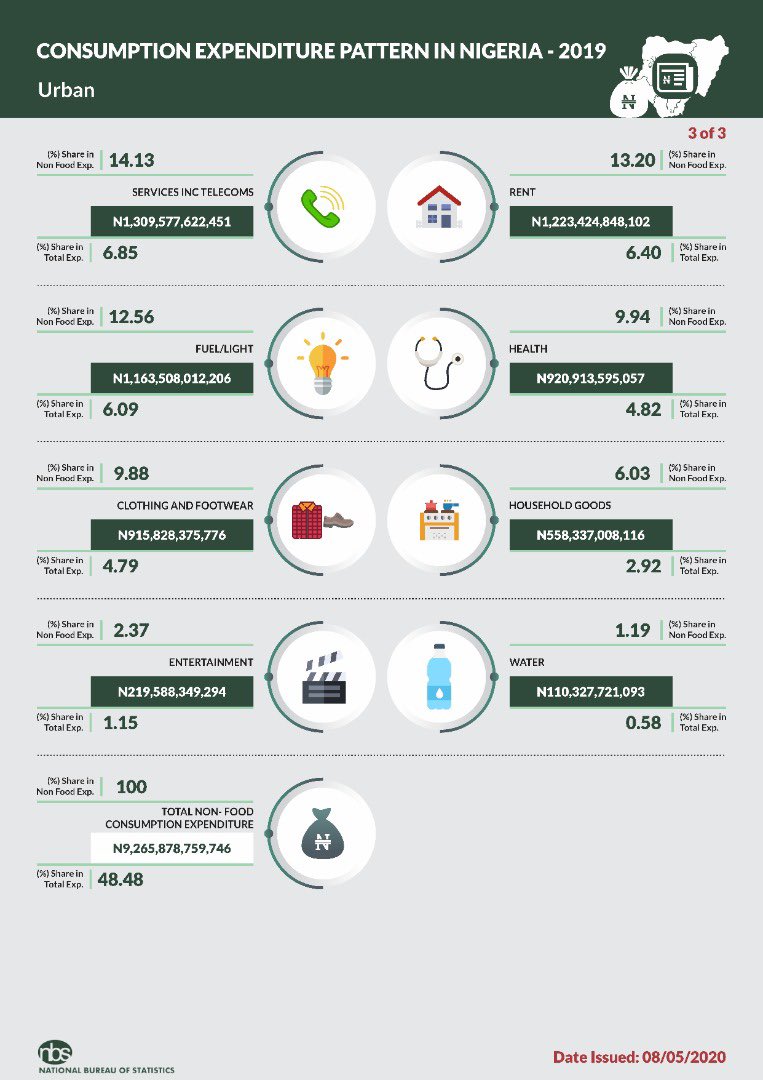
 2019 Household consumption expenditure report has been published @ nigerianstat.gov.ng/download/1094: Urban sector expenditure on major food and non food categories in 2019

 Q4 2019 GDP published @ nigerianstat.gov.ng/download/1066 Q4 2019 Oil GDP grew by 6.36% from 6.49% in Q3 2019 & -1.62% in Q4 2018. Q4 2019. Non oil GDP grew 2.26% from 1.85% in Q3 2018 & 2.70% in Q4 2018.Oil GDP at 4.59% for 2019 (0.97% in 2018).Non oil GDP at 2.06% for 2019 (2.0% in 2018)


 Q3 2019 Foreign Trade in goods report published @ nigerianstat.gov.ng/download/1033. Total Trade in Q3 2019 ⬆️6.8% Q on Q & ⬆️1.3% Y on Y. Imports ⬇️ 2.7% Q on Q & ⬇️7.4% Y on Y, while exports ⬆️15% Q on Q & ⬆️8.9% Y on Y. Trade Balance ⬆️to N1.38tn from N0.59 in Q2 2019 (N1.08 in Q3 2018)


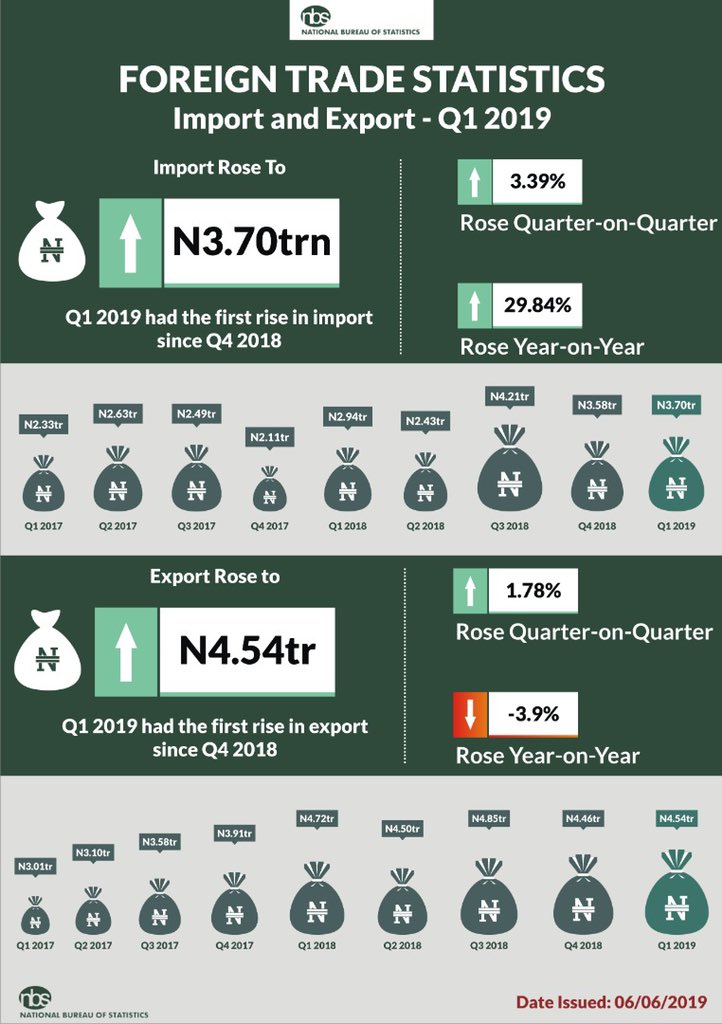
 Q1 2019 Foreign Trade in Goods report published @ nigerianstat.gov.ng/download/953 Summary of Trade. Exports up 1.78% Q on Q but down -3.9% YOY; Imports up 3.39% Q on Q and up 29.8% Y on Y. India, Spain and Netherlands top export destinations while China, Swaziland and USA top imports