Sonu Varghese Profile picture
Musings on investing, the economy & all else. VP, Global Macro Strategist, @CarsonGroupLLC Advisory services through CWM, LLC, Registered Investment Advisor.
Jan 5 5 tweets 3 min read
Solid headlines on the payroll report, but more mixed under the hood 🧵

Probably a sign of normality more than anything, and normal means these reports will have some hot data, some cold data 🤞

More thoughts here 👇


@CarsonResearch @RyanDetrick

1/carsongroup.com/insights/blog/… 3-month average of job growth is 165k.

That's down from a year ago, but still solid. 2019 averaged 163k a month.

What's amazing is that 2023 saw 2.7 million jobs created 💪

1940-2023 -
Avg: 1.5 mil
Avg ex negative years: 2.6 mil

Unemployment rate sub-4% for 23 months 👌

2/
Image
Image
Apr 12, 2023 9 tweets 6 min read
Bit of a mixed CPI report.

Headline CPI up 0.1%, while core CPI rose 0.4% in March.

Headline is now up 5% y/y, well off the peak 9.1% in Jun '21 and back Aug '21 levels.

🧵below

@CarsonResearch @RyanDetrick

1/ Image Energy has driven the pullback.

Makes up ~ 7% of CPI, split almost equally between commodities (gasoline) & services (electricity, piped gas).

Commodities prices are now below Dec '21 levels.

Services prices are down 4% since Jan. Thanks to falling natural gas prices.

2/ Image
Apr 8, 2021 13 tweets 6 min read
Thread on taxes paid by US multinationals, for perspective on magnitudes👇

Even post-TCJA (Tax Cut & Jobs Act of 2017), we didn't see a shift in profits away from tax havens.

28% of 2018 profits were generated in tax havens, similar to 2017.

(IRS yet to release 2019 data)

1/ 65% of foreign profits were generated in tax havens, incl. Caribbean, Ireland, Singapore, Netherlands, Switzerland, Puerto Rico (favored by pharma).

And it hardly changed between 2017 & 2018.

Note this is up from ~25% in mid-1990s. via @M_C_Klein.

ft.com/content/47d783…

2/
Jan 2, 2021 7 tweets 3 min read
2020 saw a huge turnaround within the S&P 500 index after the vaccine news broke on 11/9/20.

Stocks that fared the worst through 11/9/20 saw the largest increases post-vax (on average, through year-end).

Sector attributions below 👇

1/ Image Tech/Cons. Dis/Comm. made up all the returns until 11/6 with Financials/Energy dragging.

Post-vax news, Financials was the biggest contributor, though Tech was still #2.

Energy continued to dragged!

2/ Image
Nov 27, 2020 10 tweets 5 min read
The 2020 stock market recovery should not be surprising given the V-shaped recovery in corporate profits, which are now higher than they were at the end of 2019 (h/t @lhamtil).

Thread on what drove this, using sectoral balances & Levy-Kalecki 👇

1/ Levy-Kalecki profit equation recap:

Corporate Profits =
Investment
+ Dividends
- Household Saving
- Government Saving
+ Current Account Surplus

Business investment & current account surpluses are profit sources.

Household & government savings subtract from profits.

2/
Nov 25, 2020 4 tweets 2 min read
Disposable income fell 0.7% in October but still remains 2% above pre-crisis trend.

Employee compensation growth slowed to +0.7%, & remains 4% below trend.

Proprietors' income rose +1.2% in October (due to CARES Act assistance to farmers) and now 5% above trend.

1/ Image So far disposable income has remained above trend, in sharp contrast to what happened in 2008-2009.
Question is whether that continues, especially if fiscal aid is not coming.

2/ Image
Aug 24, 2020 5 tweets 3 min read
On the topic of the stock market vs the real economy, there's lot of information once you disaggregate the "stock market", as @NathanTankus pointed out.

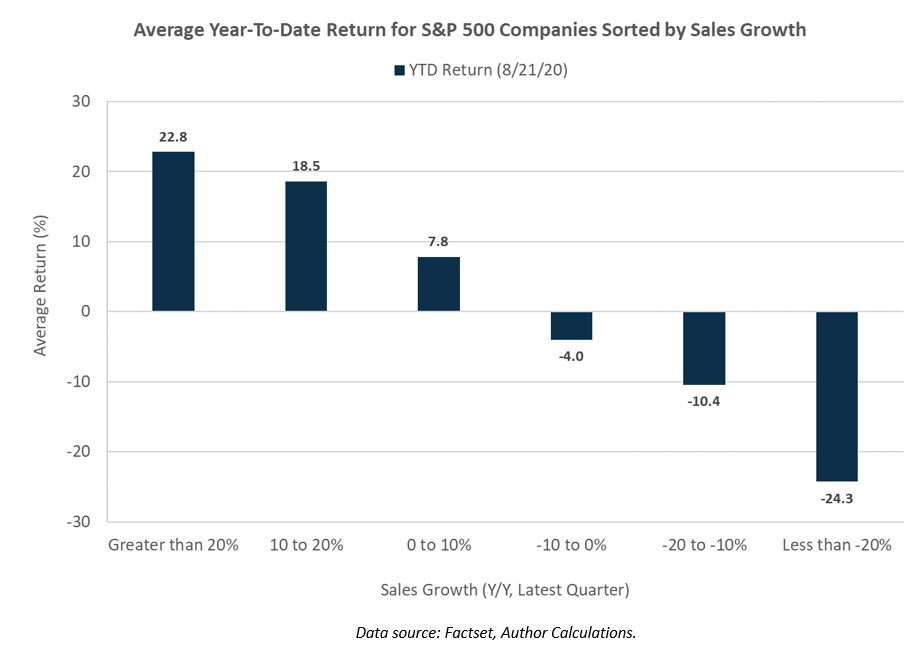
Here's avg YTD returns for S&P 500 companies disaggregated by sales growth

Sales >20% y/y: +23% ytd
Sales <-20% y/y: -24%

1/ Another simple disaggregation is by market cap.

Again, a wide dispersion, which wasn't the case back in February.

Avg. YTD returns for Market Cap > $200 Bil
As of 2/19: +8%
As of 8/21: +19%

Avg. YTD returns for Market Cap < $25 Bil
As of 2/19: +0.5%
As of 8/21: -14%

2/
Mar 13, 2020 14 tweets 3 min read
This is the 10th bear market for the S&P 500 (price index) since 1950.

Few notes on the nine previous ones 👇

1/
1956-1957 Bear Market: -21.5%

Start: Aug 6 1956
Bottom: Oct 22 1957
Recovery: Sep 24 1958

- 15 months to bottom
- 11 months for recovery

Amid the "Eisenhower Recession" of 1957-'58 that lasted 8 months

2/
Mar 12, 2020 16 tweets 5 min read
Stocks plunged again, but are we close to the end?

Suffice to say I have no idea.

It hasn't paid to be alarmist over the past 10 years i.e. every drawdown was a "buy the dip" opportunity.

But it is useful to look at the other side of the coin: Bear markets.

Thread 👇

1/
Large sustained bear markets, like 2007-2009 or 2000-2002, don't go down in straight lines.

Very frequently, there are reversals, with sharp gains.

Which makes it look like the worst is over.

Then markets fall again, and the cycle repeats. Until final capitulation.

2/
Feb 5, 2020 21 tweets 9 min read
Thread on sectoral balances that make up the Levy-Kalecki corporate profit equation, & implications for the US economy today.

Corporate Profits =
Investment
+ Dividends
- Household Saving
- Government Saving
+ Current Account Surplus

Charts & useful links coming up 👇

1/
In short, business investment & a current account surplus are profit sources.

Household & government savings subtract from profits.

@RomanchukBrian has a really good primer on the profit equation here:

bondeconomics.com/2018/06/primer…

2/
Dec 20, 2019 13 tweets 4 min read
Been an amazing decade for US stocks, especially compared to International (USD terms)

2010 - 2019 (Nov)

US (MSCI): 246%
World Ex US (MSCI): 63%

Breaking down International -

Developed (MSCI EAFE): 73%
Euro Zone (MSCI EMU): 56%

Emerging Markets (MSCI EM): 38%

Thread 👇 1/ This is a massive reversal from what we saw in the prior decade. Starting after the 2000-2002 bear market,

from 2003 - 2009 -

US: 48%
World Ex US: 133%

Developed: 105%
Euro Zone: 124%
Emerging Markets: 311%

2/
Jul 20, 2019 4 tweets 2 min read
Great piece by ⁦@JWMason1⁩ on the rising stock of multi-family units the rise of the renter, which impacts the political economy of housing, and 1/ jwmason.org/slackwire/the-… Also impacts monetary policy as currently practiced: “ if conventional monetary policy works primarily through residential construction, and residential construction is a permanently smaller part of the economy, that is another argument for broadening the Fed’s toolkit.” 2/