Data from the standard EcoInvent lifecycle database shows that:
• Typical Dutch bike: 96kg CO2e release incl. 19,200-km lifecycle parts = 5g of CO2e per km
• Food: 16g CO2e
• Total: 2️⃣1️⃣g/km
@newitguy2@SecretaryPete Interesting: cycling releases 2.7 times less CO2e than walking (56g CO2e per km).
1) Toronto's population will grow 50% in the next quarter-century. You think streets are congested now? Try adding 50% more cars.
There just isn't enough room on the surface to fluidly move all those people & even more later. @tommybj1950@marcusbgee The only way to move today's population (+50% in a generation) is through space-efficient modes of transportation.
Walking, transit, cycling require up to 20× less pavement per person = therefore, must be prioritized.
This is not some #WarOnTheCar. It's basic geometry.
May 1, 2020 • 6 tweets • 7 min read
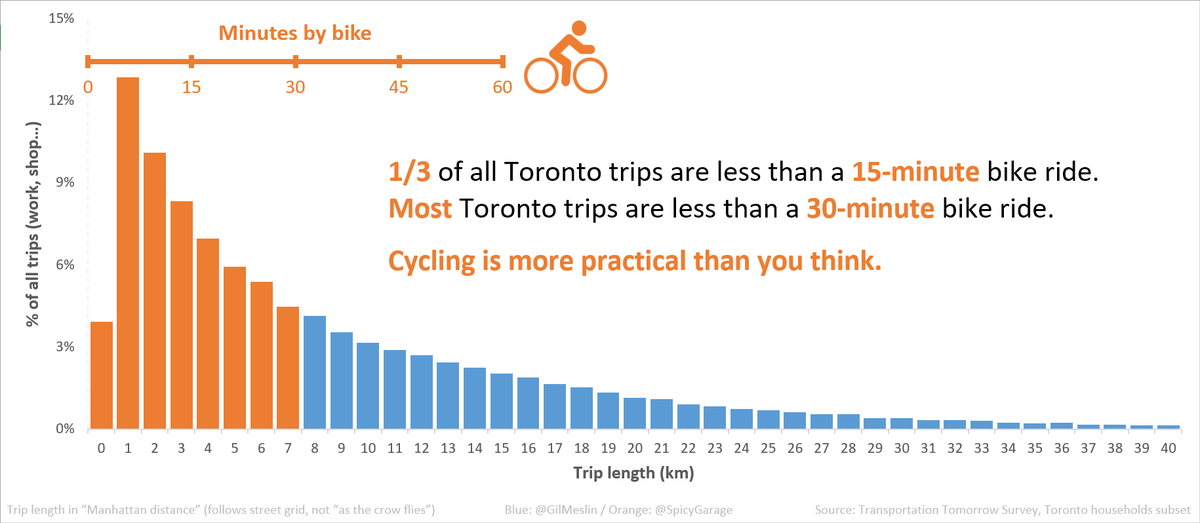
@quipianist@bigfishstone@jen_keesmaat@demescope It depends. Census numbers tend to focus on commuting to work, likely the longest trip anyone makes (thus least likely by bike). In the Toronto CMA, 1.6% of people commute to work by bike.
But availability of safe, separated bike lanes has a huge impact: it's 34% in Cabbagetown.
@quipianist@bigfishstone@jen_keesmaat@demescope It's a chicken-and-egg problem: many people just won't bike if they have to share lanes with speeding drivers. As bike infrastructure has grown, more people commute to work. (⬆️88% in the past twenty years, vs. 32% for driving.)