We analyze the options market. Daily Research: https://t.co/XTAUMUtGlI YouTube: https://t.co/s0HBvNufnw… Disclaimer: https://t.co/3dBKPL2sgx…
14 subscribers
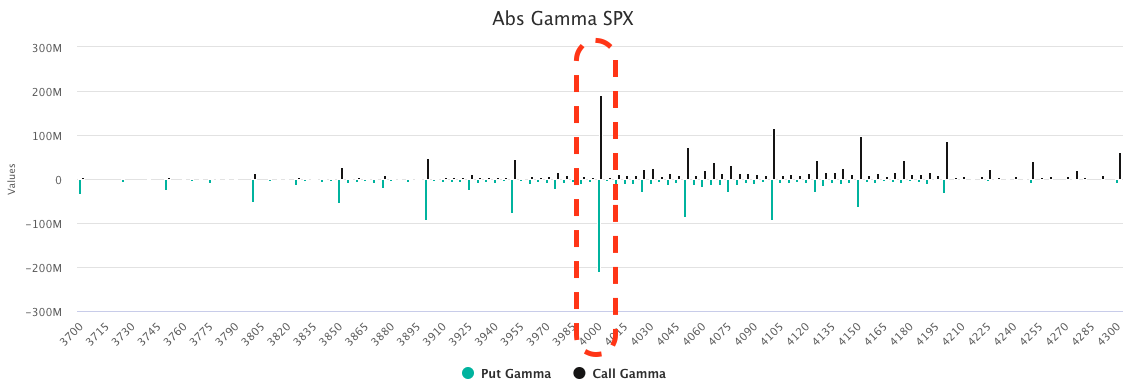
 The put gamma is driven by huge volume in 9/12 exp puts. gamma is highest for near term & atm options. We read a lot of these puts as sold, and that helped to push the stock up. A lot of these may be covered as the stock reverts. This all adds short term volatility/reversion
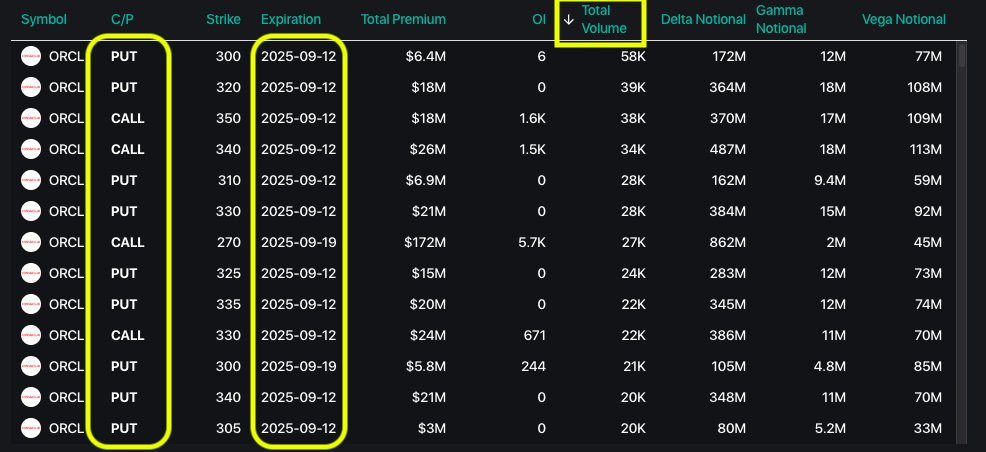
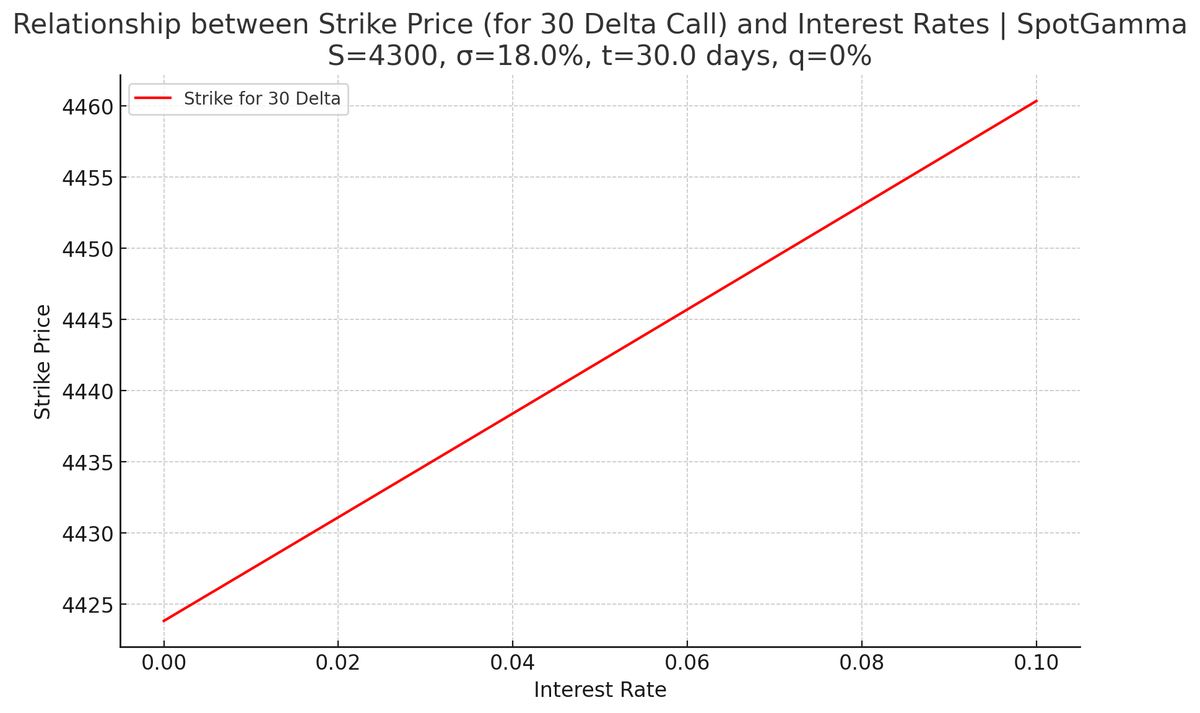 The foundation of options pricing, black scholes, uses the following inputs:
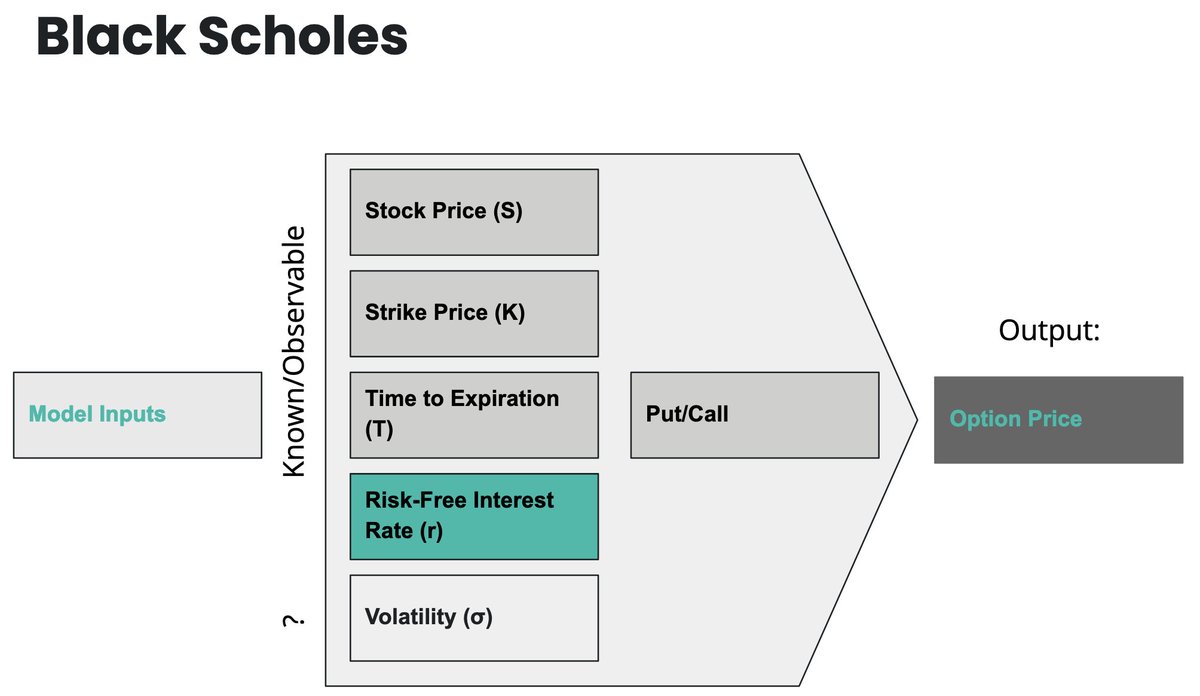
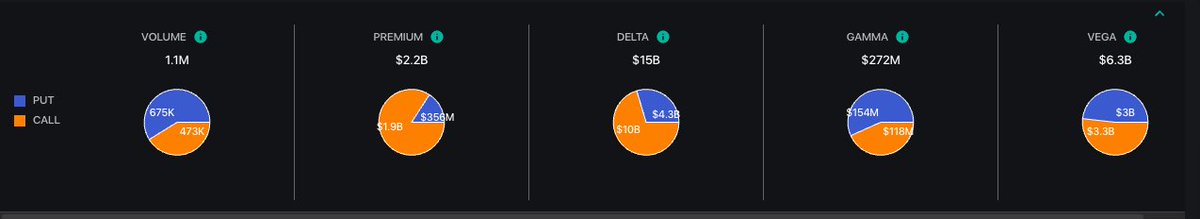
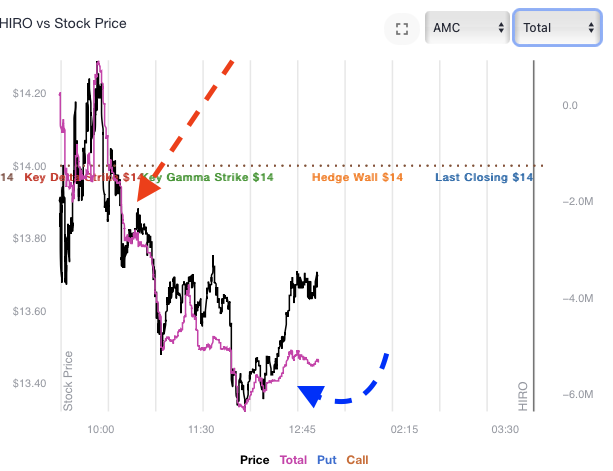
 HIRO, which measures hedging impact from options trades in real time, shows us that "all expiration" flow is well above that of 0DTE.
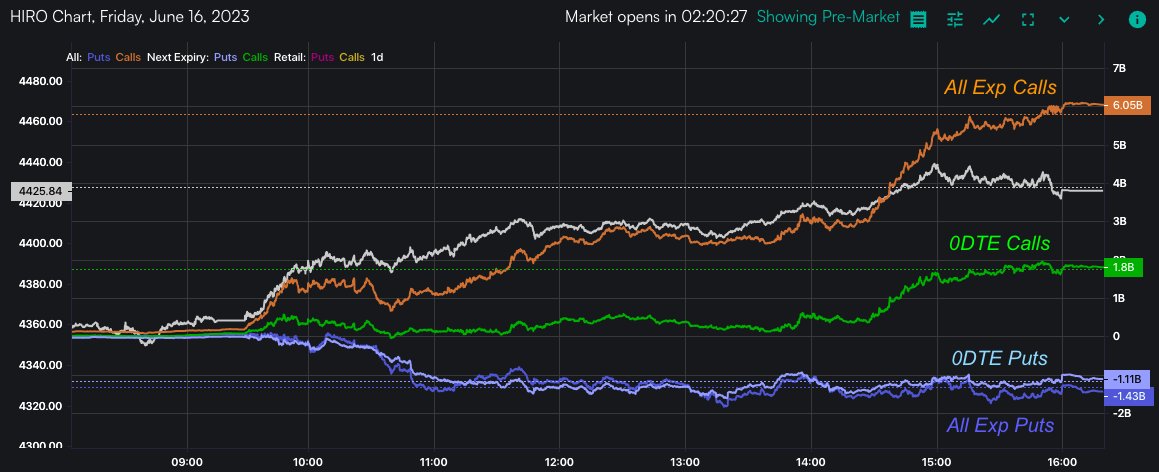
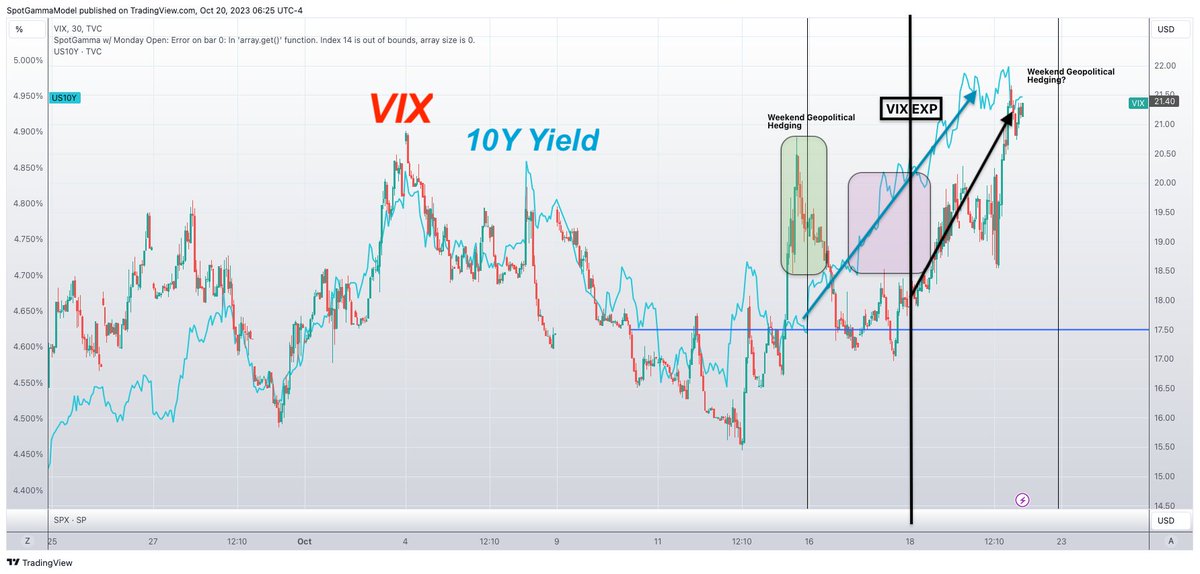
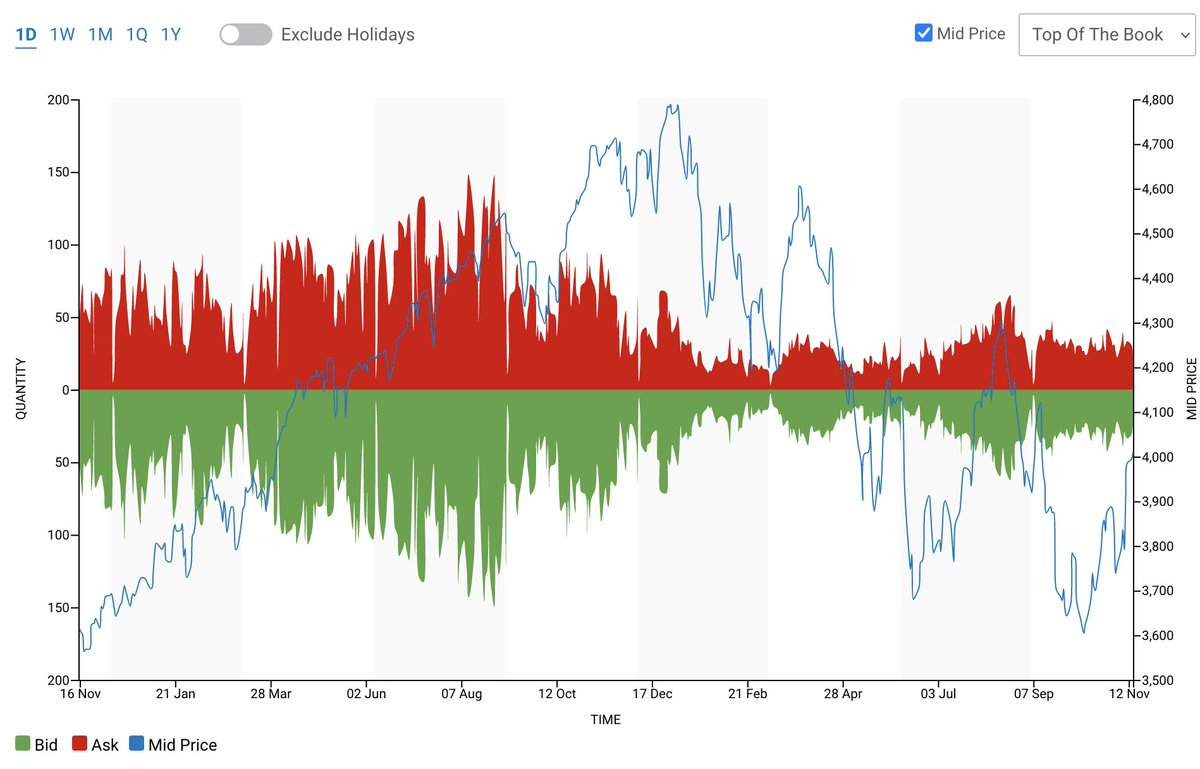
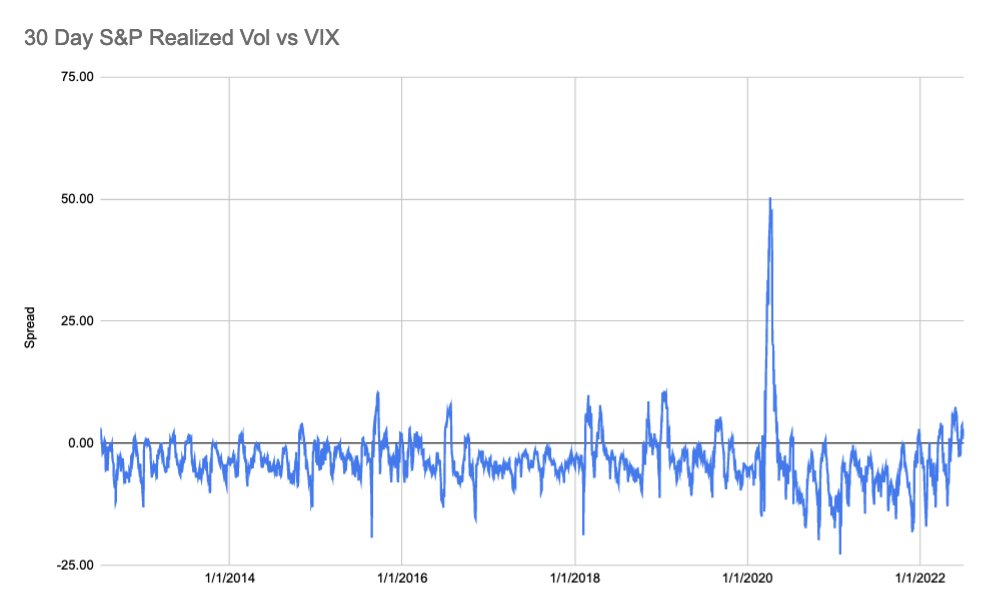
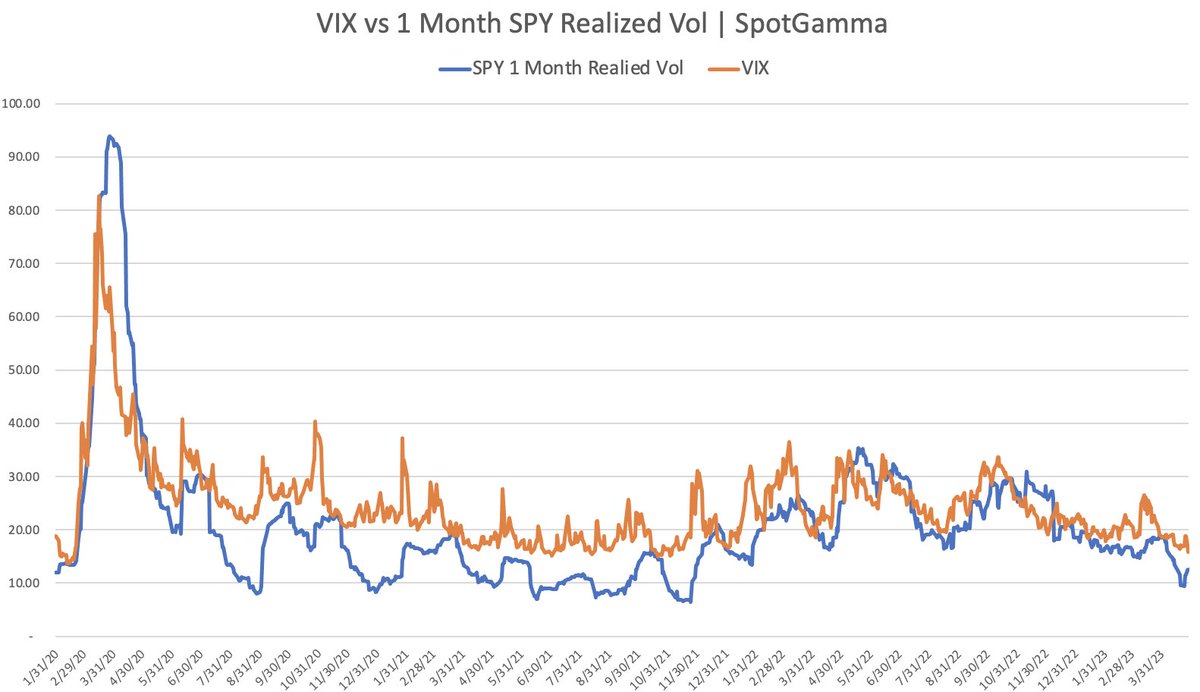 📚 Quick recap: Realized volatility (RV) is the actual, historical price movement of an asset, while implied volatility (IV) is the market's expectation of future volatility, embedded in option prices.
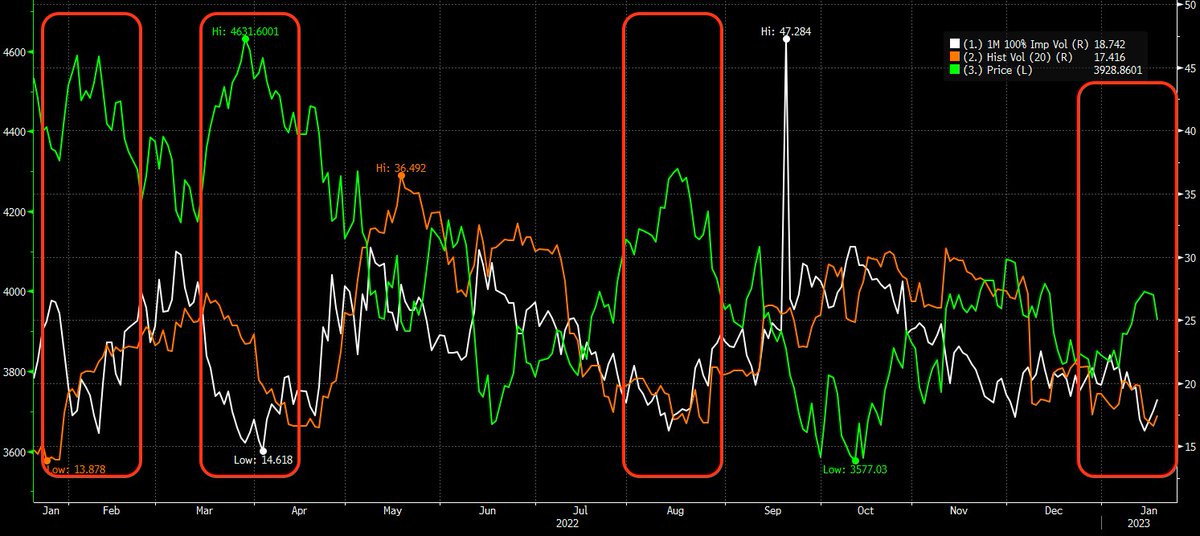 In the red boxes you can see that the spread between IV and RV compress as the market peaks.
 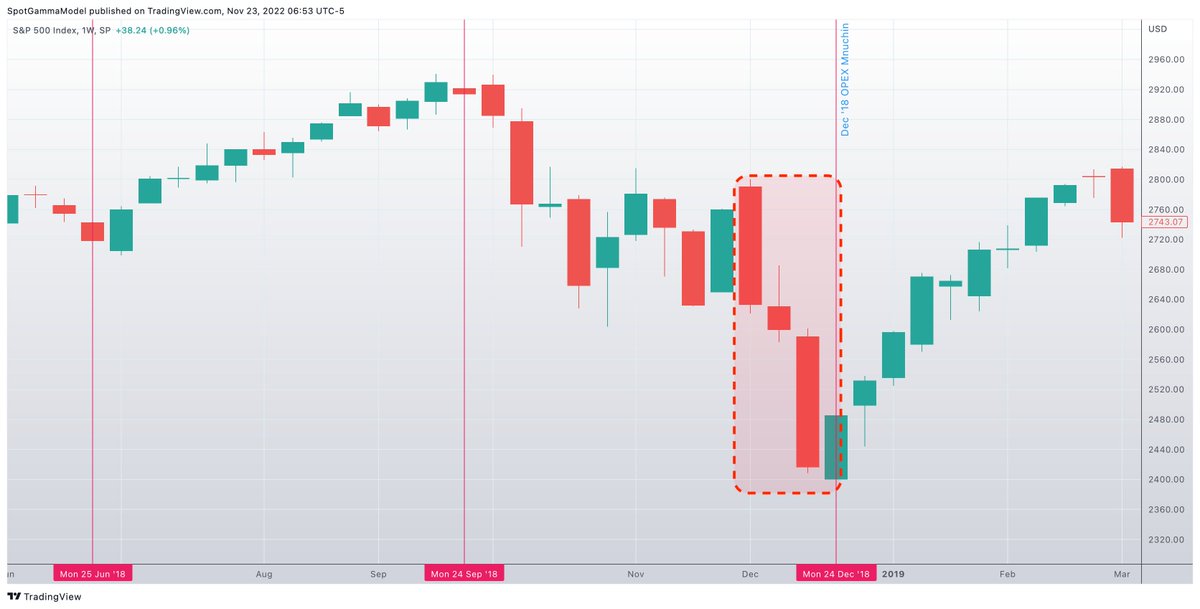 Here is total delta notional by expiration, broken out by puts & calls.
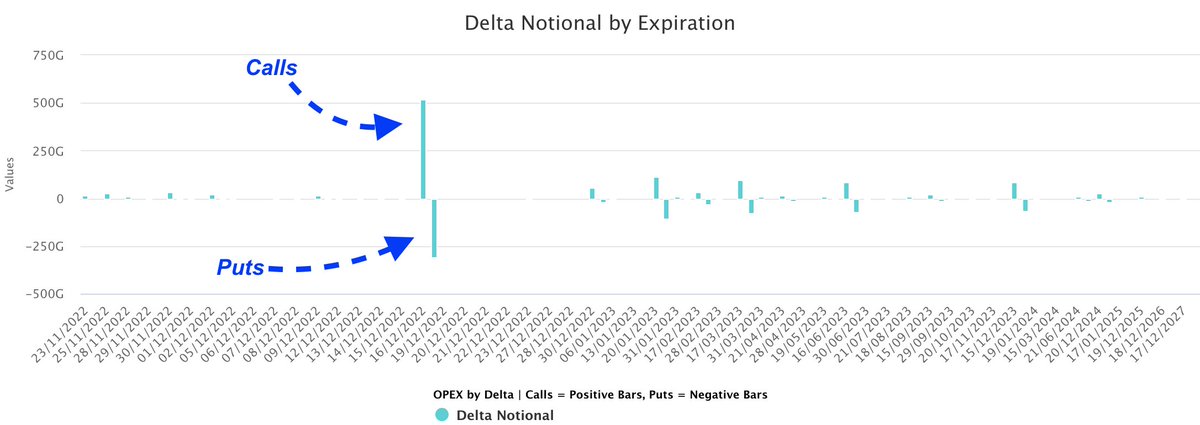
 What those charts seem to show is all customer flow. Not just "retail" but Hedge funds and other buyside entities.
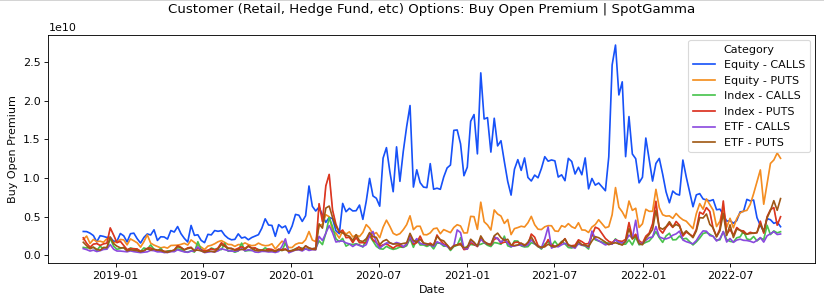
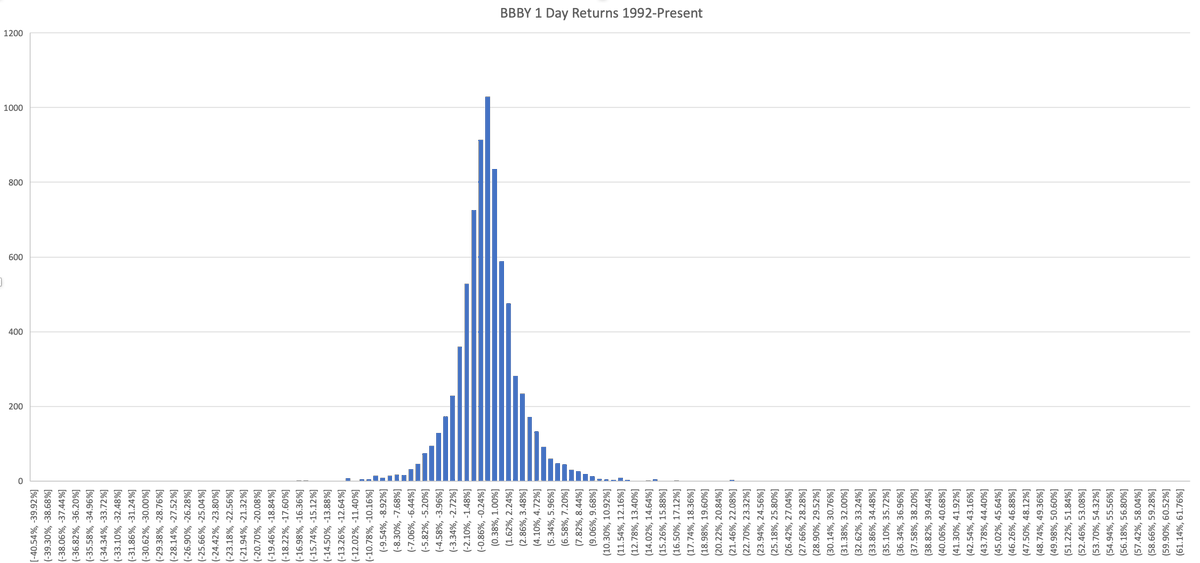 Over those 30 years, there have been some volatile times for BBBY, namely 00's bubble, '09 GFC and '20 Covid Crash.
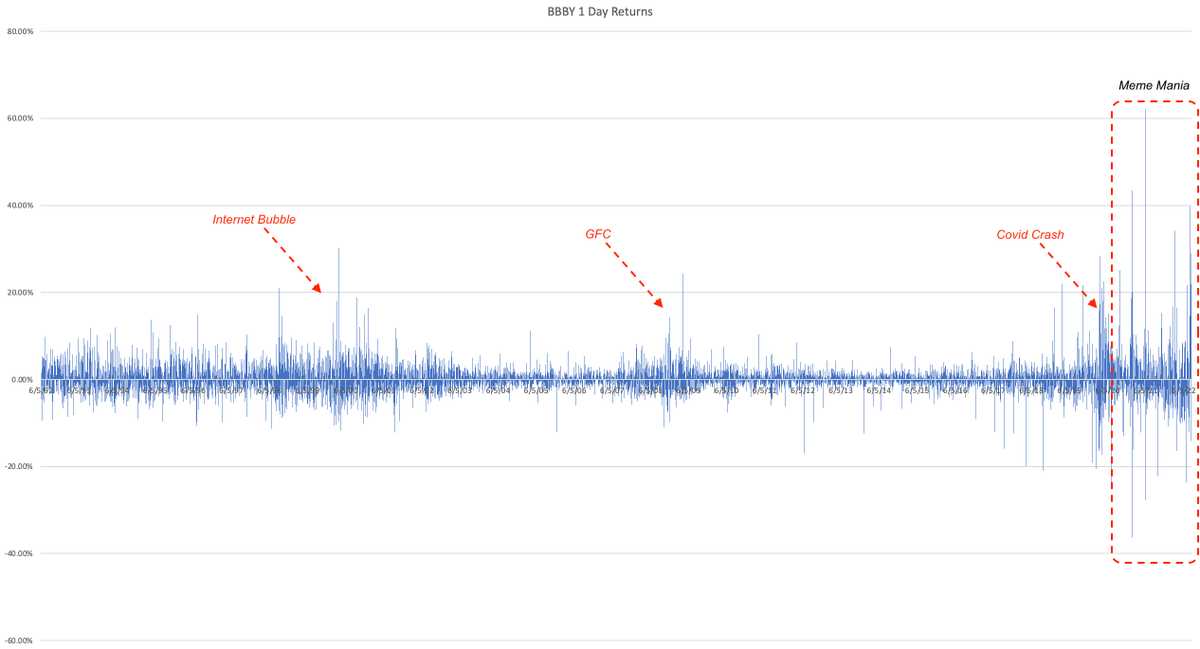
 Major recent lows were tagged by a confluence of large options expirations and accommodating fiscal/monetary policy i.e. positional + fundamental catalysts
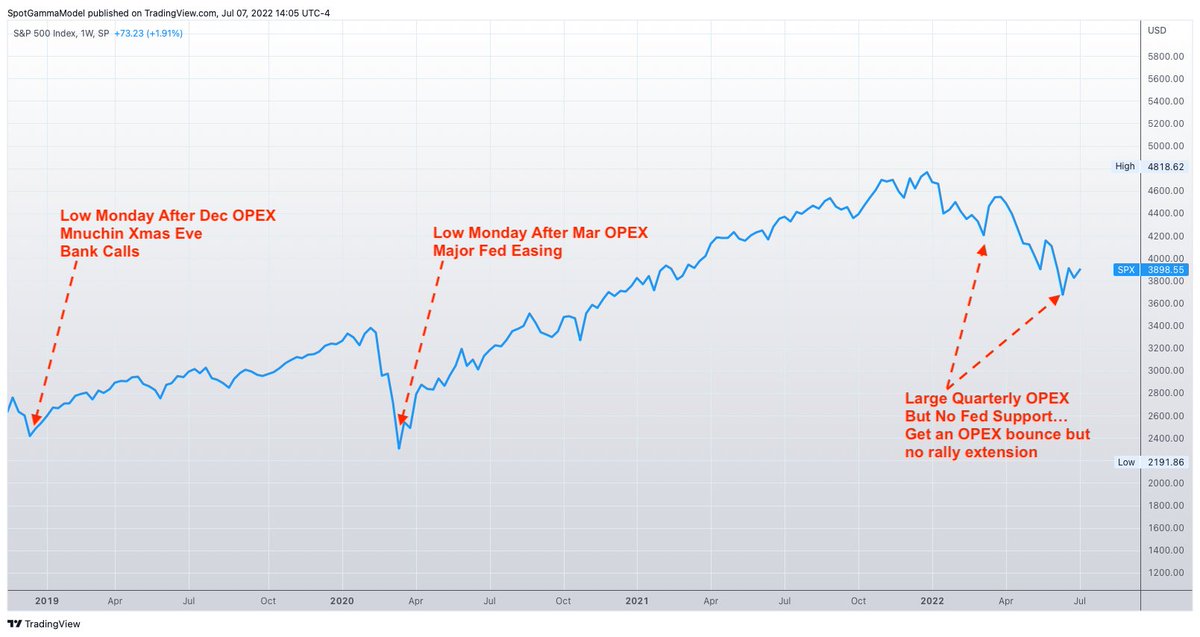
 When "deltas are negative" it implies that traders are buying puts &/or selling calls.
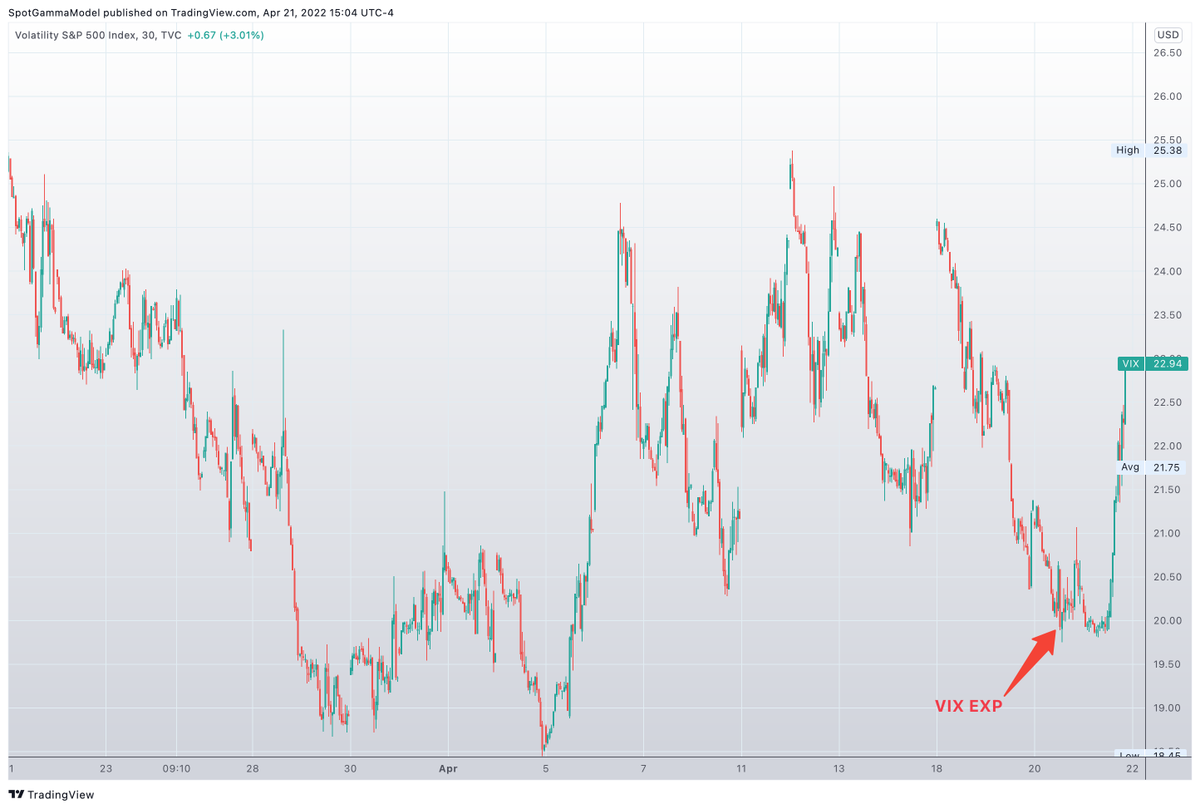 Making things trickier y'day was QQQ -1.2% while SPX closed flat. S&P relative strength seemed real.
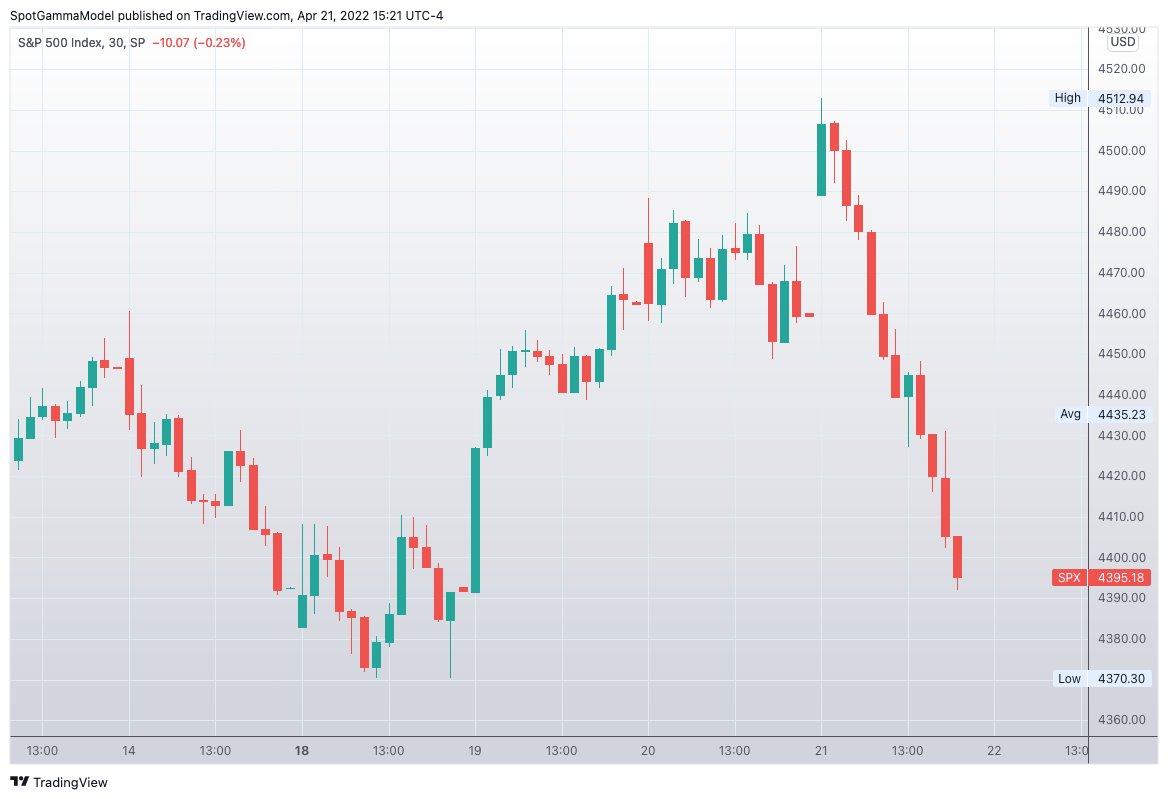
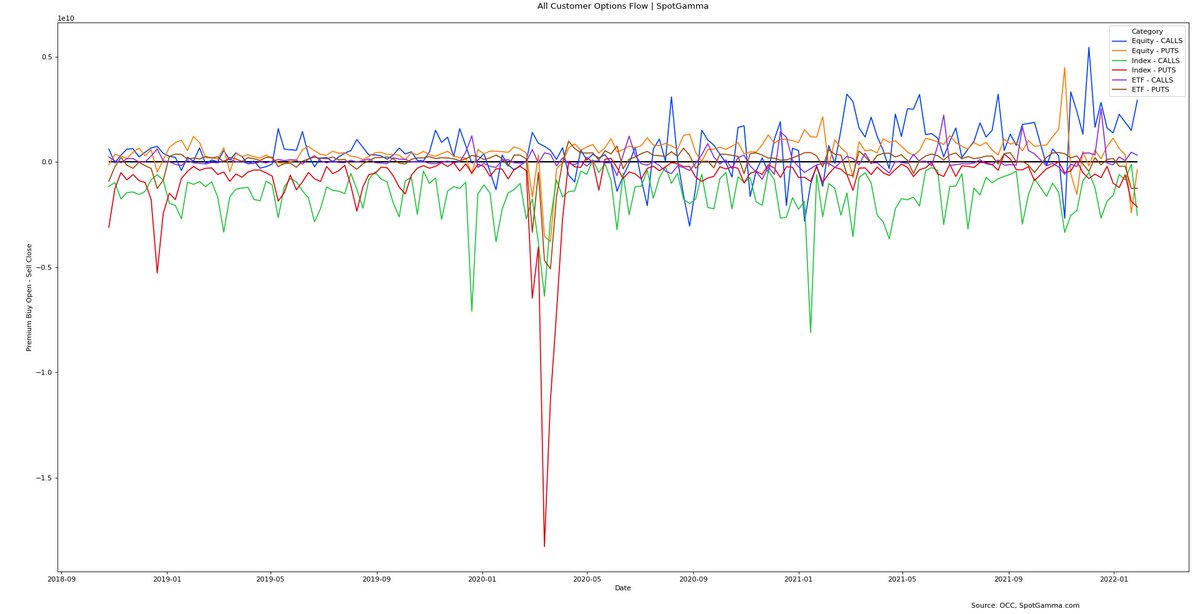
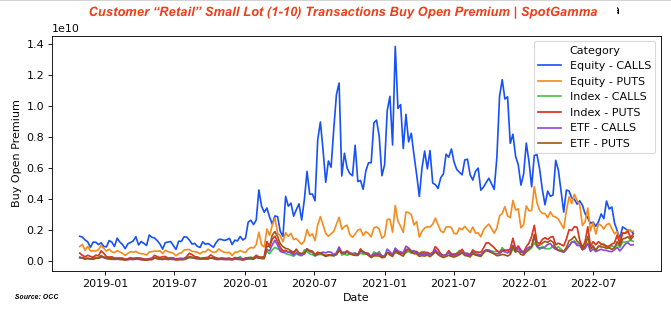
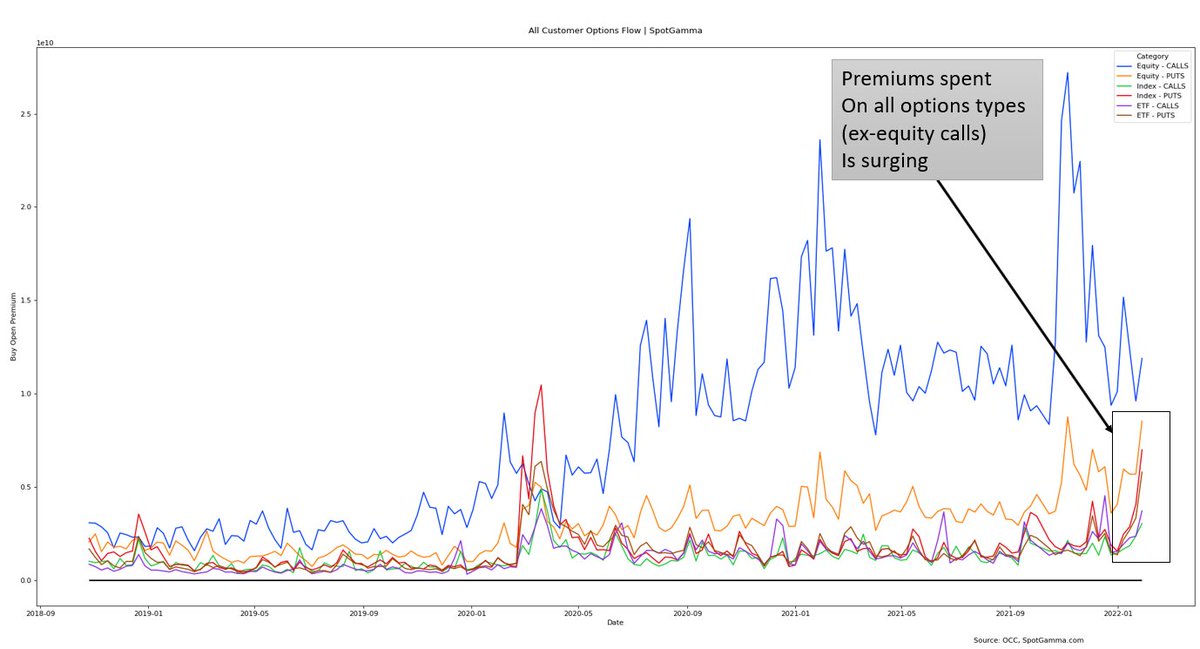
 Here's options data from the OCC. These plots show the premium per trade aggregated each week, with calls in blue and puts in orange. This is only customer flow(i.e. retail, hedge funds)
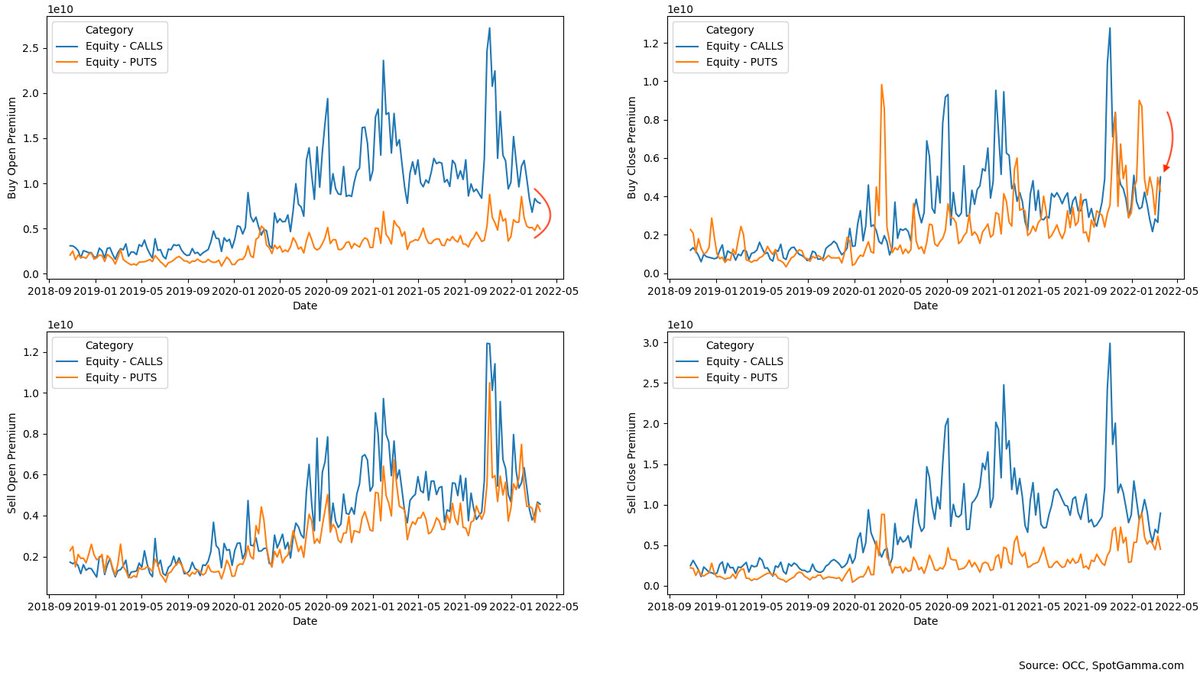
 Above is just "buying to open premium", here we've netted premiums buying to open vs selling to close.