Steven Anastasiou Profile picture
Economist @econ_uncovered | Unraveling the US economy, with a focus on inflation, jobs & the money supply | Former sell-side research analyst
2 subscribers
Oct 8, 2023 22 tweets 6 min read
Varied commentary on the US jobs report can give you the impression that the economy is either booming, or on the brink of a recession.

A comprehensive analysis shows that the employment market is relatively solid, but that warning signs exist.

Here’s what you need to know: 🧵 Taken as a whole, the latest US employment data continues to show that the jobs market remains relatively strong.

The unemployment rate remains relatively low. Image
Sep 28, 2023 11 tweets 3 min read
US commercial bank lending has slowed to a crawl, with 6-month annualised growth falling from 14.7% in August 2022, to just 0.6%.

This highlights the major impact of the Fed's tightening, and that further rate hikes aren't needed to tame inflation.🧵

economicsuncoveredresearch.com/p/lending-data… Encouraging deleveraging is the key factor by which higher interest rates work to slow economic growth & inflation, as this flows on to slower (& potentially negative) growth in the M2 money supply.

The stagnation in bank lending since February thus provides a clear signal ... Image
Aug 9, 2023 12 tweets 5 min read
In July, I expect annual US CPI inflation to rise to 3.2%, vs 3.0% in June.

At the same time, I expect the core CPI to hit 4.6%, down from 4.8% in June.

Once adjusted for spot market rents, I expect both the headline & core CPI to be <2% YoY.

Here's my July US CPI preview:🧵 Image With wholesale used car prices (as per the Manheim Used Vehicle Value Index) seeing several months of significant declines, I expect CPI used car & truck prices (whose retail prices tend to lag the Manheim Index by 2 months), to begin recording significant MoM declines in July. Image
Jul 11, 2023 19 tweets 6 min read
In June, I expect MAJOR additional disinflation.

I forecast annual CPI growth of 3.0%. Adjusted for spot market rent, I forecast growth of just 0.5%.

I forecast core CPI growth of 4.9%. Adjusted for spot market rent, I forecast growth of 1.7%.

Here's my June US CPI preview: 🧵 CPI used car & truck prices are likely to see a major deceleration in price growth in June.

This comes as the Manheim Used Vehicle Value Index, which measures wholesale prices and tends to lead the CPI’s retail prices by two months, saw unadjusted growth of just 0.1% in April.
Jun 26, 2023 25 tweets 6 min read
The Great Depression: Part 1

Despite a weakening economy & aggressive Fed tightening, the stock market has remained resilient.

While perplexing many, the 1920s stock market boom & the events of 1928-29 reveal many striking parallels to today.

Let’s take a step back in time: 🧵 The year is 1928.

Following the first trading day of the year, the Dow has risen 218% from its August 1921 low.

Much of this growth has been driven by margin loans, with many retail investors joining in on the stock market craze.
Jun 16, 2023 28 tweets 8 min read
MAJOR US CPI disinflation is likely in June.

My flash June CPI estimate is 3.0% & just 0.7% ex-lagging shelter!

I expect the core CPI to fall from 5.3% to 4.9%.
Ex-lagging shelter, I expect core growth of 2.8%.

Will the Fed really keep hiking amidst such a backdrop? 🧵 Image With the M2 money supply seeing its largest declines since the Great Depression, inflation has declined significantly & is set to fall further in June.

Let's breakdown the key price categories, and then outline what it means for Fed policy in light of the latest FOMC meeting. Image
Jun 12, 2023 25 tweets 9 min read
In May, I forecast US CPI inflation to fall to 4.2% (from 4.9% in April).

Once you take lagging shelter out of the equation, I forecast annual inflation to fall to just 2.3%.

With the M2 money supply declining, inflation continues to fall.

Here's my May US CPI preview: 🧵 Image 
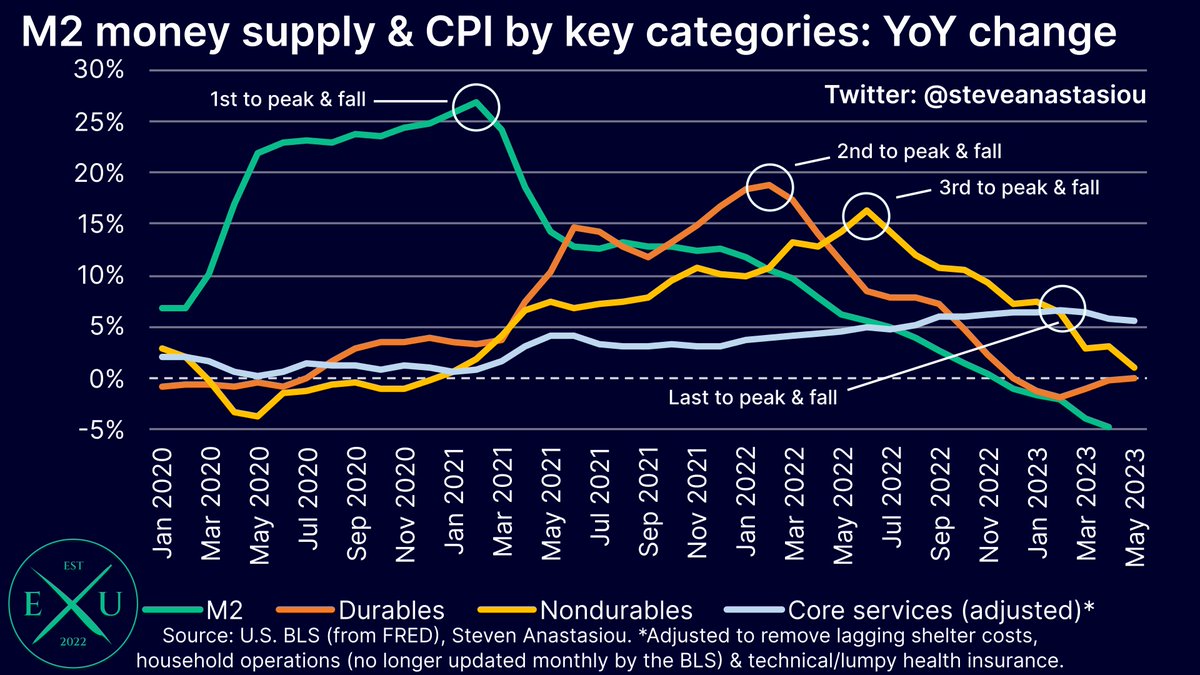
Inflation is best analysed by breaking it down into its three key components: durables, nondurables and services.

Each of these components is subject to different lags in response to changes in M2.

Remember, in the current cycle, durables moved first and services last. Image
Jun 5, 2023 23 tweets 6 min read
This time is always different … until suddenly it isn’t.

Rather than suggesting a soft landing, unemployment is normally low before the bust: it’s what leads to Fed tightening.

The bust follows with a lag.

With this in mind, let's breakdown the latest jobs report: 🧵 Image The US unemployment rate jumped to 3.7% in May. While low by historical standards, zooming in to analyse more recent trends ... Image
May 31, 2023 11 tweets 2 min read
May's Dallas Fed Manufacturing Survey saw a further decline in new orders. Hours worked fell below 0 on a 3-month moving average basis.

If the numbers aren't bad enough, wait until you see the respondent comments:

"We are seeing a massive slowdown ..."

There's more: Image Chemical manufacturing: "Volumes have not rebounded at a level we would expect this time of year. Orders seem to be more erratic, which is in line with automotive & building construction markets trending downward as interest rates have deeply impacted both ... sectors."
May 27, 2023 9 tweets 3 min read
"Core" measures aren't better inflation metrics.

Critically important food & energy prices aren't things that are better off ignored.

Furthermore, their removal means that the 2nd phase of the price cycle is largely skipped, encouraging a LAGGED response to inflation. Image Yes, core measures can be useful in eliminating MoM price volatility that can occur on account of items like gasoline prices, but there's another way to smooth out MoM volatility - look at a longer time frame!
May 19, 2023 34 tweets 10 min read
The next two months are likely to see MAJOR disinflation in the US CPI.

I currently forecast the CPI to fall to 3.1% & the CPI ex-lagging shelter to fall to 0.9% in June.

This is likely to DRAMATICALLY change the inflation & Fed policy debate.

Here's what you need to know: 🧵 Image Before conducting a medium-term inflation forecast, it's important that one takes stock of two key factors: 1) the M2 money supply; and 2) the price cycle.

For while shorter-term price forecasts (i.e. 1-3 months), will be largely dictated by recent price trends, over a ...
May 17, 2023 6 tweets 3 min read
Cyclical areas of the economy are showing that the Fed's aggressive tightening, which has seen the largest declines in the M2 money supply since the Great Depression, are starting to increasingly bite.

The latest data to show this was US manufacturing industrial production ... twitter.com/i/web/status/1… Image which recorded another YoY decline on a 3-month moving average basis, falling to -0.6% in April.

Furthermore:
2) YoY retail trade sales turned negative in April; Image
May 11, 2023 21 tweets 8 min read
Inflation - want to gain a more detailed understanding of where things stand?

The next 18 charts will do just that.

1) To understand where inflation is headed, follow the money & understand the importance of the price cycle.

First, the money supply changes, then prices ... Image move with a lag. Durables tend to have the most elastic demand & move 1st.

The US is now in the 2nd phase of the disinflation cycle as food & energy prices moderate/fall.

Many think that services prices are the best "underlying" measure - they're actually just the most LAGGING.
May 8, 2023 8 tweets 3 min read
The US jobs market is weakening: understanding why requires looking beyond the unemployment rate, which is a heavily lagging indicator.

Instead, here are 7 key data points to be aware of:

1) 3-month moving average private payroll growth has more than halved since Sept 2022. Image 2) With private payroll growth moderating significantly, job growth is instead being supported by government payrolls, which on a 6-month moving average basis, are around peak COVID rehiring levels. Image
May 5, 2023 23 tweets 5 min read
Many thought that after First Republic Bank was dealt with, that the banking crisis would fade away.

Regional bank shares have since fallen another 15.4%.

As long as the Fed maintains its aggressive tightening and bank deposits fall, banking troubles will grow.

Here’s why:

1/ Image As banks hold only a FRACTION of customer deposits as cash on their balance sheet, in the event that a bank loses deposits, it faces a liquidity drain, as its cash assets are used to satisfy deposit withdrawals.

Particularly large deposit outflows can cause banks to fail.

2/ Image
Apr 11, 2023 23 tweets 7 min read
On the surface, the US jobs market looks relatively strong.

Though a deeper look at the underlying shifts taking place, shows an employment market that is losing momentum.

These 20 charts will give you a comprehensive picture of the US employment market, and its direction: 🧵 Following total jobs growth that has been revised to 472k and 326k in January and February respectively, nonfarm payrolls are estimated to have grown by 236k in March. Image
Mar 14, 2023 32 tweets 9 min read
Markets have been unnerved by bank collapses.

Bond yields have plunged.

Fed tightening expectations have been slashed.

Meanwhile, the next US CPI report is around the corner. I expect further YoY moderation, but elevated MoM growth, which risks further unnerving markets.

A 🧵 Image The first detail to unpack is that of used car prices. While many have noted the increase in the Manheim Used Vehicle Value Index, it's important to note that the Manheim Index measures wholesale prices. The CPI instead measures retail prices.
Mar 13, 2023 17 tweets 4 min read
By holding only a fraction of customer deposits as cash reserves, the banking system relies on confidence. When confidence is lost (as occurred at Silicon Valley Bank), runs occur & banks fail.

Will the joint government & Fed actions ward off the risk of further bank runs?

A 🧵 The biggest risk that SVB's collapse poses to the US economy, is that it triggers a broader loss of confidence in the banking system, and a wave of customers withdrawing deposits, which in turn risks further bank runs and collapses.
Mar 12, 2023 26 tweets 7 min read
At the end of 2022, Silicon Valley Bank was the 16th largest bank in the US.

It's now the 2nd largest bank to collapse in US history.

Here's what led to the collapse of SVB, and the warning that it provides to the US economy at large: a 🧵 QE, ZIRP & enormous money printing fuelled vast malinvestment in the US economy.

Serving US venture-backed technology companies, SVB was at the forefront of such malinvestment.

As a result, it saw astounding deposit growth, which more than tripled over the past three years.
Mar 3, 2023 39 tweets 10 min read
Over the last month, we've seen:

- hotter than expected inflation;
- surging nonfarm payrolls; and
- a jump in retail sales and real PCEs.

Is this the beginning of a big flip in economic activity & a second wave of inflation?

Here's my breakdown of where things stand: a 🧵 In order to determine the direction of the economy and inflation, one needs to determine the key drivers of economic activity over the year ahead.

Right now, the biggest story remains the Fed's aggressive tightening, which has led to YoY DECLINES in the M2 money supply.
Feb 8, 2023 26 tweets 5 min read
The latest monthly US jobs report claims that 517,000 jobs were created in January.

There are reasons to suggest that not only this number, but prior monthly jobs numbers, could be overstating the strength of the employment market.

Here's what you need to know: a 🧵 In February of each year (alongside January's jobs report), the BLS benchmarks its monthly jobs report (the Current Employment Statistics (CES) report), against its Quarterly Census of Employment and Wages (QCEW).