For ULTIMATE chart stack containing EP examples and respective entries marked on intraday charts
- Like & RT
- Follow @stonkssguy
- Comment "EPINDIA"
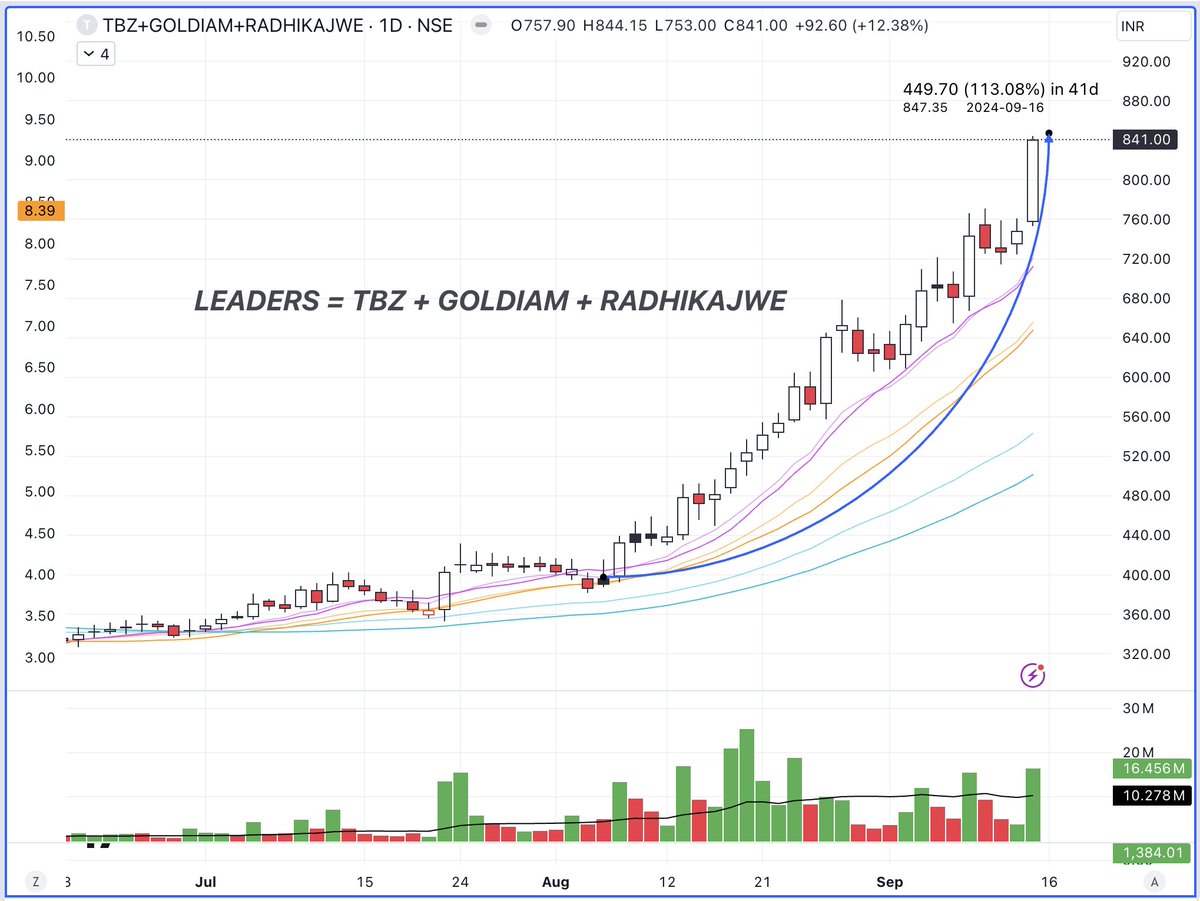
Multi-fold moves are driven by strong growth in the company's revenue and earnings, coupled with receiving consistent orders, making big leap every quarter supported with strong technicals.
Typically, stock reacts positively to any news by opening gap up and ends up making a huge move over the period of time.
Sep 15, 2024 • 6 tweets • 4 min read
Make your 1st crore by swing trading 💸🧵
It's a timeless phenomenon, has happened each time when market has emerged from a bear or consolidation phase.
There is a leadership cycle in phases of bull market, here is a simple & effective way to spot & catch momentum leaders.
Case: This is how Jewellery & Diamond Cutting stocks went parabolic in recent times...
(1/n)
Subtle signs of Accumulation
1st leg higher, usually slow but constructive action throughout.
Period where institutions & big money gets in, leaders in the group are the first ones to show such signs and often gets accumulated on same days.
Stocks being silently bought above 50 day moving average are likely the ones to move the first.
Notable dates where initial accumulation took place
7th August, 2024
#TBZ, #RADHIKAJWE, #MOTISONS (Above 50 EMA)
#GOLDIAM had earnings due, still volumes were significant
Sep 14, 2023 • 14 tweets • 9 min read
// Swing Trading 101🧵
Nearly 5000 stocks are publicly traded, this would help you zero down to best names which are likely to go north.
And no, you don't need to know what company does or actively track news to make a killing.
Price + Volume = All you need
Long read ahead.. 1.
Stocks having underlying buying force, that doesn’t rule out the possibility of breakout of a beaten down name. It simply force represents the upper hand of buyers in the stock. In cases where stock is in a base and has no recent buying force, look out for pocket pivot days
Feb 28, 2023 • 4 tweets • 4 min read
Biggest month ever!
#ADANIENT - Trading this beast whole month. Both LONG & SHORT
Was way late to the party, should have been on this thing way earlier.
Gross return : 30%
Net return: 26.75% (excluding brokerage, taxes and losses from other trades)
- Big news that had catastrophic effect on the prices
- Which led to upsurge in volatility
- Being in FnO made it free from circuit limits
- High liquidity, less slippage
Such instances are rare in Indian Markets, #YESBANK & #DHFL had similar characteristics.
It is a broad approach to overall market analysis that helps traders to realize the underlying strength or weakness associated with a market move
Thanks @PradeepBonde for the blogpost & @iManasArora for making breadth tool in context of Indian Market
(1/n)
(2/n)
Breadth will treat all stocks in an index equally. Stock with largest capitalization and the smallest are both equal in breadth analysis. It can be applied to any exchange or index of securities, any sector or industry group.