Jeffrey Ptak Profile picture
Dad, CFA, obsessive type. Morningstar Research Services.
Nov 3, 2023 11 tweets 5 min read
By popular demand (ok maybe not popular demand but @alphaarchitect asked), here's a thread on how active US stock funds have fared against their style-specific indexes (i.e., Russell index family) *before* fees over various rolling periods (i.e., 3, 5, 10 years) since 2003... Let's start with rolling three-year periods since 2003. On average, 42% of funds beat their BM before fees (by avg margin of 2.74% p.a.), 39% lagged (by -2.62% p.a.), and 19% died before reaching the end. All told, the average fund beat its index by 0.19% p.a. before fees.
Image
Image
Apr 27, 2022 4 tweets 2 min read
ARK Innovation had one of the most blistering hot streaks we've ever seen, notching a 365% gain off the Covid bottom to Feb. 13, 2021, when it peaked. But the selloff since then has wiped out ~87% of the gains it had amassed during the 3/20-2/21 run-up. It's a study in extremes. But this is what makes $ARKK a unicorn: Assets *poured* in during the run-up and, remarkably, have largely stayed put since then, despite the brutal selloff. Take the two together, and it is maybe the biggest, fastest destruction of shareholder capital in fund history.
Feb 17, 2022 8 tweets 3 min read
I *highly* recommend reading the SEC complaint against James Velissaris, mgr of Infinity Q Diversified Alpha Fund. I don't know if this would be the biggest fraud ever in a US mutual fund, but the brazenness and scale kind of puts it in a class of its own. spr.ly/6010KpQ4O The whole complaint is bonkers--the lengths to which he went to re-code the pricing model, enter fake swap terms, select incorrect pricing models, concoct a fake audit trail to cover his tracks. It's all there.
Feb 17, 2022 5 tweets 2 min read
"SEC Charges Infinity Q Founder with Orchestrating Massive Valuation Fraud | Defendant Overvalued Fund Assets by More than $1 Billion, Pocketing Millions" !!! spr.ly/6010KplCg "The complaint alleges that at times during the pandemic, the funds’ actual values were half of what investors were told." 😬
Sep 18, 2021 12 tweets 2 min read
A dozen questions on ESG I ask myself, in no particular order. 1) I’m investing in a total stock market index fund. It doesn’t intentionally incorporate ESG. If ESG is essential to investing, is my strategy incomplete? 2) I’m investing in a total stock market index fund. It doesn’t intentionally incorporate ESG. But if the market is pretty good at pricing in risks, including ESG, isn’t that what matters?
Sep 15, 2021 5 tweets 2 min read
This week on The Long View podcast, @christine_benz and I sit down with researcher Laura Carstensen, who is the director of the Stanford Center on Longevity. This was a very eye-opening discussion of work, retirement, longevity, and happiness. A thread... spr.ly/6012y4kN6 ImageImageImage We often define retirement ‘success’ in arithmetic terms—future returns, spending rates, etc. But Laura reminds us that fulfillment can often boil down to very basic, tactile factors like feeling we are living with purpose or enjoying meaningful social connections...
Aug 11, 2021 5 tweets 2 min read
These four funds had ~$9.7B in AUM as of 6/30/21. Of that, ~$7.1B was held by other JPM funds (tgt date, tgt risk; ex 529s). So at least 73% of the assets were held by other JPM funds. This makes conversion much more feasible but is not a garden variety scenario in the fund world Though the article makes some comparisons to ARK, these funds slated for conversion are nothing like ARK. The Market Expansion Enhd. Idx Fund for instance recently spread its AUM across 666 names. The other equity fund has 205 holdings, biggest weight a scant 2.7%.
Jan 26, 2021 7 tweets 3 min read
1) How well have fund fees sorted performance over the last 3 years? Pretty well. If you sorted funds by their cost as of 1/1/18--5 being lowest-cost, 1 being highest-cost--you find cheaper funds did better than average and costlier funds worse than average. Not a big surprise. 2) It follows that cheaper funds survived+succeeded (ie, beat avg peer) more often than pricier funds, as shown below. (Distribution across these buckets: Cheapest 10% of funds in 5, next 22.5% in 4, middle 35% in 3, next 22.5% in 2, and costliest 10% in 1.) Again, unsurprising.
Jan 3, 2021 10 tweets 4 min read
How'd funds fare in 2020 when viewed through an ESG lens? We assign Globe Ratings, w/'High' (ie 5 globes) going to funds whose holdings court less ESG risk and vice versa for 'Low' (1 globe). Tldr: Funds w/higher ESG ratings beat their M* idx more often than those w/lower ratings 
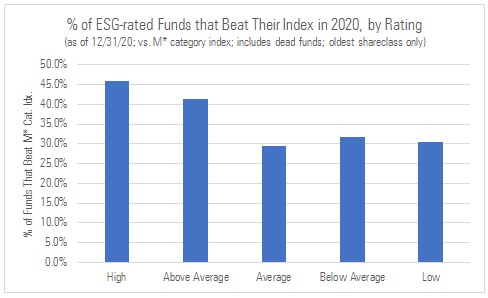
Given this, it's not too surprising that higher ESG-rated funds generated larger avg. excess returns (vs. M* cat. index) in 2020 than lower ESG-rated funds, meaning there was a better payoff to investing in funds that courted less ESG risk. That said, caveats apply...
Jan 2, 2021 4 tweets 1 min read
A few stats on funds that gain 100%+ in a calendar year:
- This has happened 129 times over past 30 years, 15 in 2020. Very rare. Amounts to ~0.20% of all rtns reported
- Subsequent avg. annl. returns of these funds are as follows:

t+1yr: -12.2%
t+2yr: -18.6%
t+3yr: -18.3% In reviewing above, keep a few things in mind:
- 88 of the 114 w/measurable subsequent rtns came in '99. These were go-go tech/internet funds that went boom, bust (t+3yr avg. rtn=-24.1% p.a.)
- On bright side these funds are likelier to survive: Only 2 died over subsequent 3-yrs.
Jan 1, 2021 6 tweets 3 min read
Happy new year. To help us all sober up, here's prelim data on the % of active stock and bond mutual funds that beat their M* category index in 2020. All told, 37% of active funds did so (45% before fees), down slightly from 2019 when 40% succeeded (53% before fees). (1/6) Image 
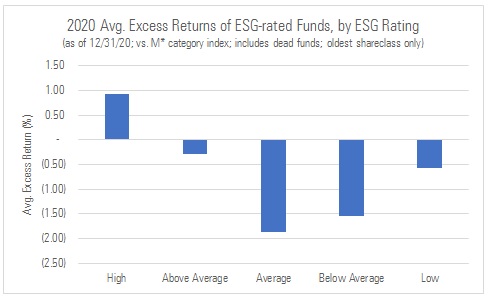
Does the picture improve any if we look at active fund success rates on a risk-adjusted basis (i.e., Sharpe Ratio)? No. It gets worse, with 31% of active stock and bond funds topping their M* category indexes (38% before fees). (2/6) Image
Dec 5, 2020 6 tweets 2 min read
This piece harshes on target-date funds, which is kind of unfortunate. TDFs aren't *perfect* products, but why should perfect be the enemy of good when good is an excellent outcome for defined-contribution investors? wsj.com/articles/the-h… TDFs are all-in-one solutions that automate important tasks that experience and research has shown a lot of investors can't handle if left on their own. Namely, adopting a suitable asset allocation; diversifying widely; rebalancing; adjusting the asset mix; etc.
Dec 21, 2019 25 tweets 9 min read
1/ This is a tweetstorm on something that's kind of niche so if you're not interested in bond quality, fund classifications, and ratings - skip this. But I did want to expand on the analysis we published yesterday. You can find that analysis via the linked tweet below. 2/ What's this all about? The NBER paper made 3 assertions: 1) Fund cos were overstating credit quality of their bond funds' holdings when reporting to us; 2) we misclassified funds by relying on that faulty data; 3) we assigned incorrect Star Ratings to funds we'd misclassified
Dec 8, 2019 17 tweets 7 min read
1/ Investors rely on our M* categories so it's only fair they be scrutinized. That's what this FT article does, taking issue w/how we place funds in our 'World Stock' categories. I think it's off base and I'll explain why in this thread. ft.com/content/e91751… (cc: @brookefox91) 2/ Before we go any further, here are the definitions for our two World Stock categories--World Large Stock and World Small/Mid Stock. Note the US stock range: 20-60%. Keep in mind that the MSCI ACWI Lg Idx is 57%/43% US/non-US; the SMID version is ~50/50 morningstar.com/content/dam/ma…
Nov 6, 2018 9 tweets 4 min read
1) Over the two decades ended 9/30/18, the avg dollar invested in US stock funds gained ~8.0% per year after fees (blue line in chart), ~8.8% p.a. before fees (green line). This estimate is derived using the monthly rtns and net assets of all US equity funds, dead and alive. 2) Interestingly, that 8% avg annl. asset-wgtd rtn only slightly lagged the rtn of a blended index (orange line in chart) that mirrored the breakdown of assets across the nine style-box categories over the 20-year period. Before fees, the average dollar *beat* the benchmark. 😮