
Director, Institute for Employment Studies @EmploymtStudies
Get involved in our Commission on the Future of Employment Support at: https://t.co/IaUbcCdcxS
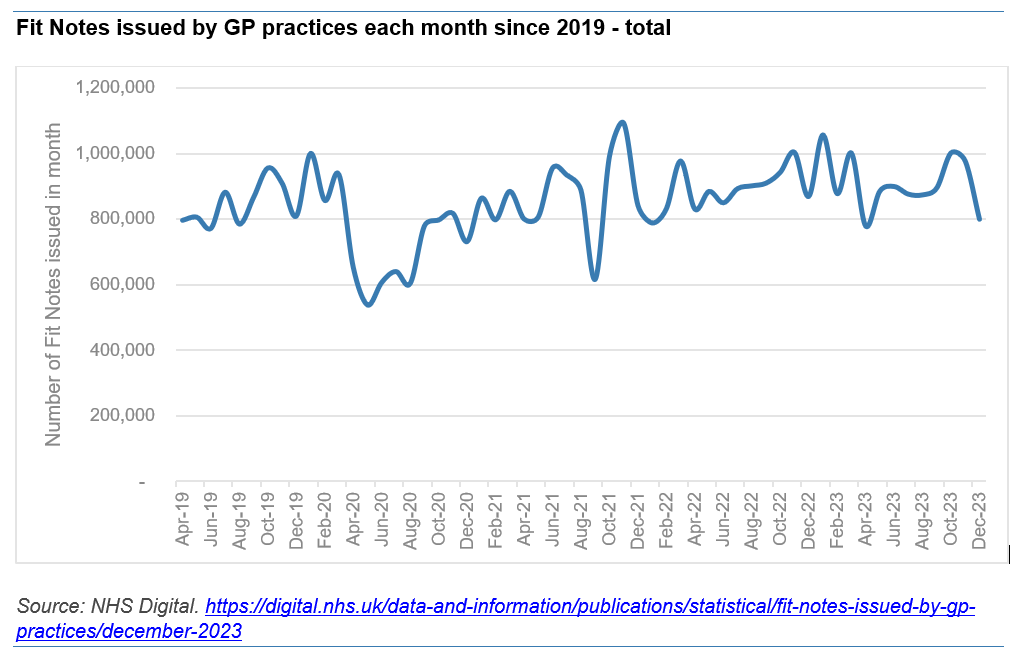 So it's basically flat, save for the lockdowns (we don't have comparable data pre 2019).
 ... having known since 2018 that or approach was badly failing, rather than concluding we should sanction FEWER people govt has ended up sanctioning MORE.
 On how it's skewed, this is my take on the cost per additional job, per measure, using the OBR data.

 ... which raises the forecast participation rate by about 1/4 of a percentage point (dotted blue vs blue line).
 So if those are the headline findings, what about impacts for disabled people specifically?

 First up and most worrying. Slightly lower econ inactivity is due to a HUGE fall in student numbers (yellow), while long-term ill health has ticked back up again (blue).
 This shows more clearly trends since start of pandemic. Half million more out of work, driven by 600k+ rise in econ inactivity, esp in last few mths. Employment also still down on pre-crisis, with unempl lower too.

 The worst news today is on pay. Graph above shows nominal pay still ~4% and bonuses dropping back a bit, but rocketing inflation meaning real pay is falling by 3%+.
 For example, if we have the same estimates for April as we did for March, then this is what would happen to the quarterly headline figures.
 The fall in job exits overall is mainly due to fewer people becoming workless - as job-to-job moves remain at basically highest ever. Remarkable level of labour market dynamism - generally good for wages, but hard work for employers, esp. with low unemployment 2/

 In fact here's the data - number of people who started or are waiting to start a new job cf. same week in three years pre-pandemic. Dotted line is 4-wk moving average.

 Second is scope.
 PAYE is a partial measure from payrolls (as PM said). It shows payrolls are back above pre-crisis, which the official 'employee' data shows too albeit with different trend. But the reasons for these difference matter, as the 'record' isn't *just* cos self-employment is lower 2/
 First the headlines: unemployment nearly back to pre-crisis (black dot in middle), with big falls in most recent quarter.

 Confirmation that Employment Bill has been dropped.
 Headlines first - left graph shows total changes since crisis began on LFS measures, with the quarterly change in yellow. Right hand side is HMRC PAYE data.
