Tim Wallace Profile picture
Senior Editor for Geography @nytimes PhD @UWMadisonGeog
Oct 26, 2020 6 tweets 2 min read
The cartotwitterati love to point out that land doesn't vote (often with a finger wag and a blown gasket or two). Nevertheless (😏), this is how agricultural areas "voted" in 2016. And forested areas.
Sep 2, 2020 10 tweets 5 min read
Do the natural colors that paint the landscape you call home give a hint about how you might vote in November? To some degree, yes.

The True Colors of America’s Political Spectrum Are Gray and Green nytimes.com/interactive/20… I've been staring at earth imagery and election results for at least four years, trying to find some kind of key trend in the relationship between the two. But for the most part, what I saw was either obvious or uncompelling (no offense, former me).
Sep 17, 2019 29 tweets 14 min read
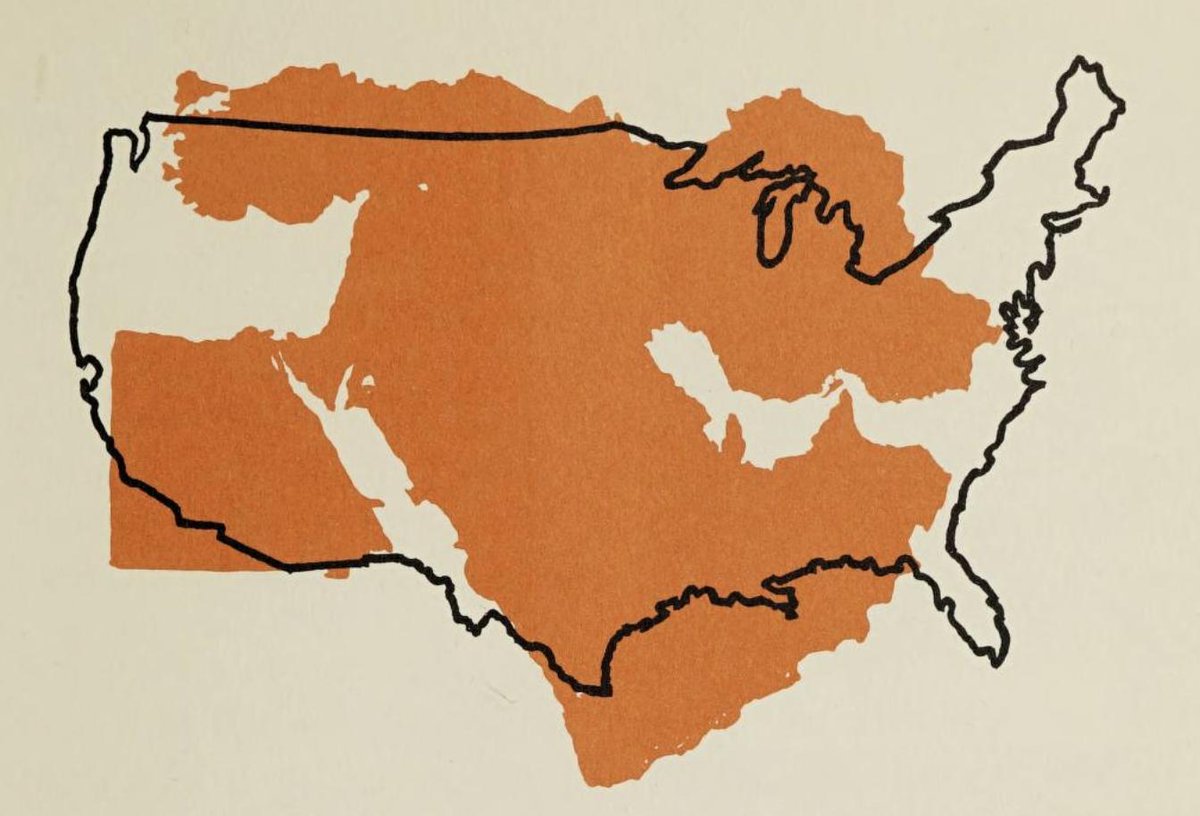
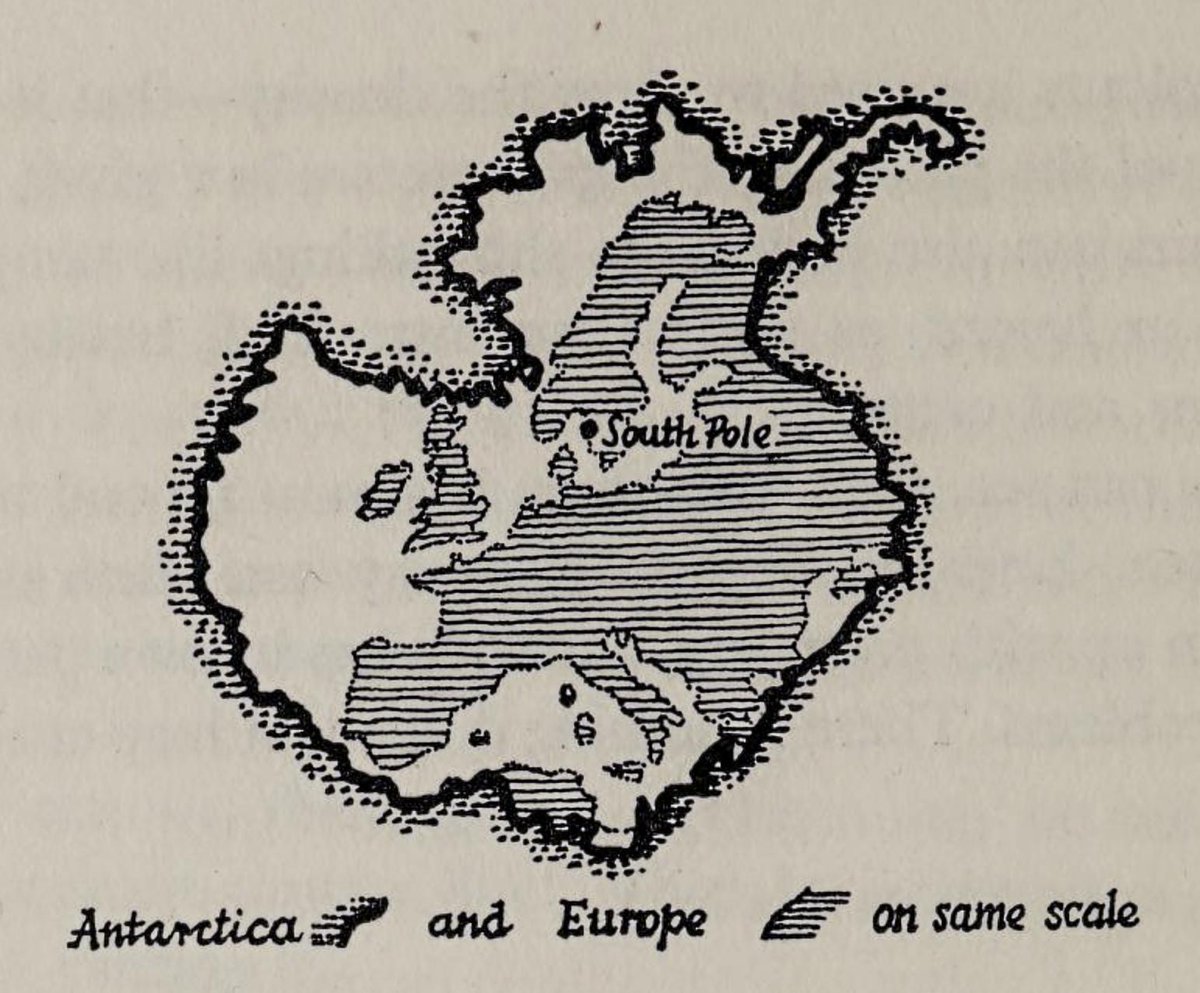
I run into these comparative maps all the time—showing one territory superimposed over another—so I'm gonna start dumping them all into this one thread.

1. Middle East in orange over the US, 1962. archive.org/details/howpeo… Image 2. Antarctica and Europe on same scale, 1962. archive.org/details/explor… Image
May 18, 2019 5 tweets 2 min read
This 1953 Fortune two pager on How the New Suburbia Socializes is fascinating. How homeowners get together. Social leaders, deviates, older couples and feuds all influence flows.
Jan 31, 2019 5 tweets 2 min read
This image from today shows that the polar vortex dropped some legit sea ice off in Chicago before heading east.

👀 The full scene is just bonkers.
Jul 28, 2018 19 tweets 6 min read
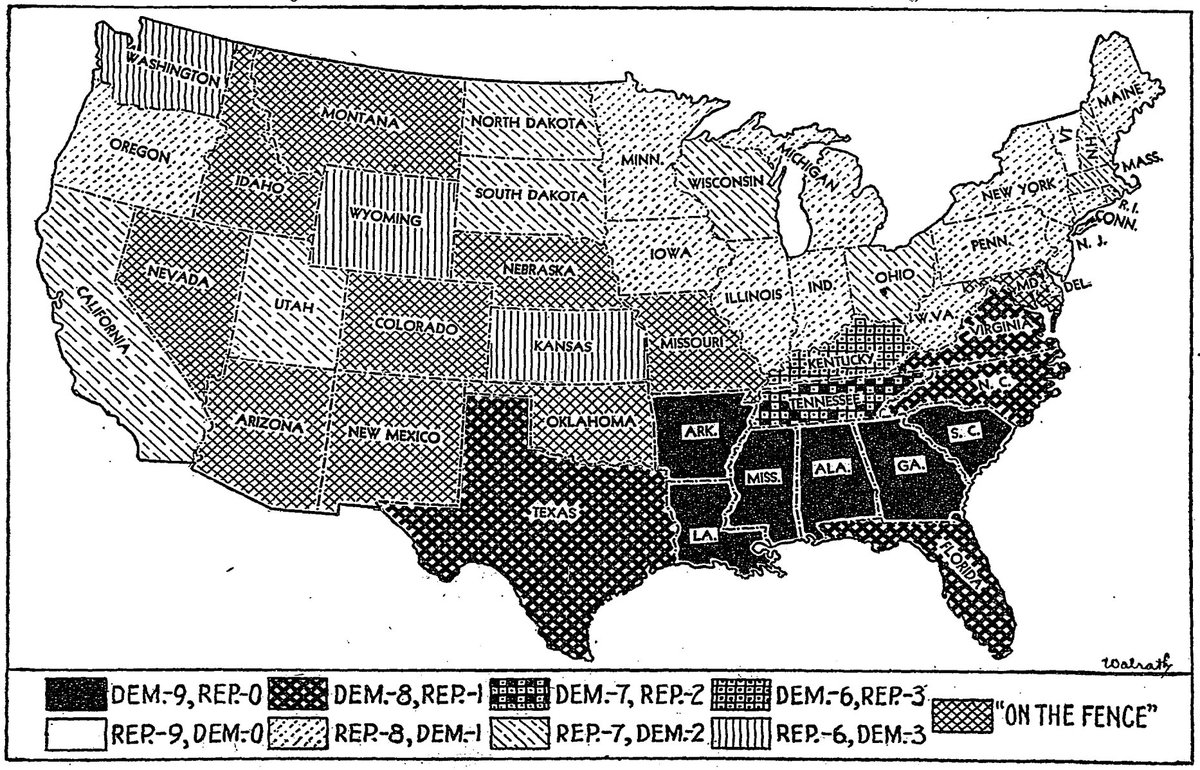
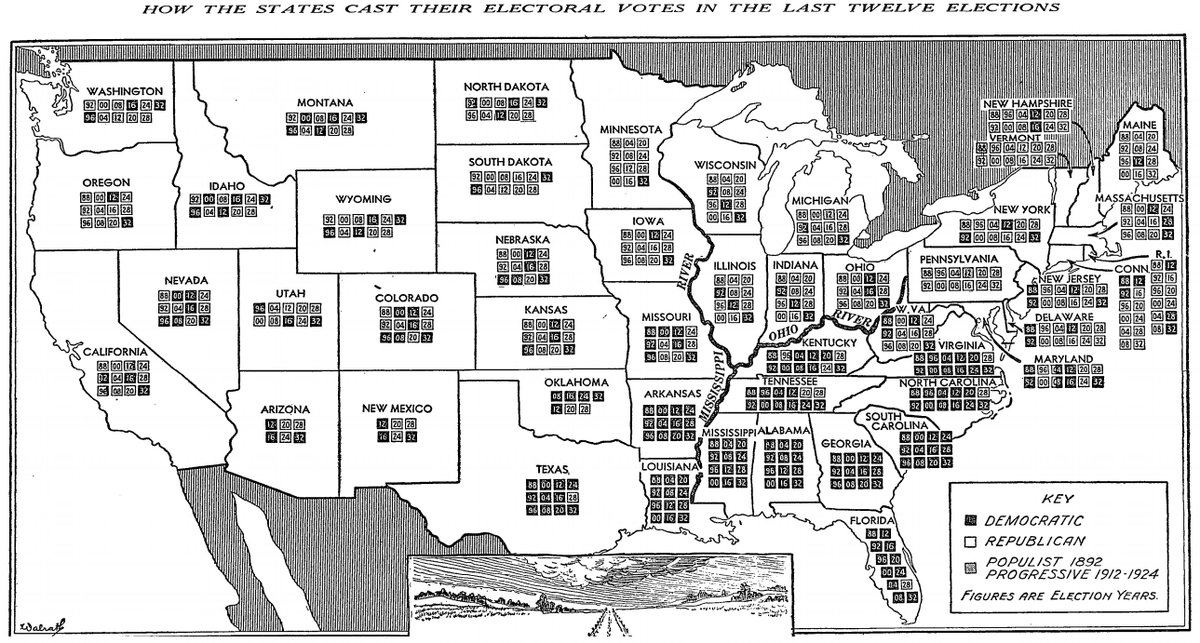
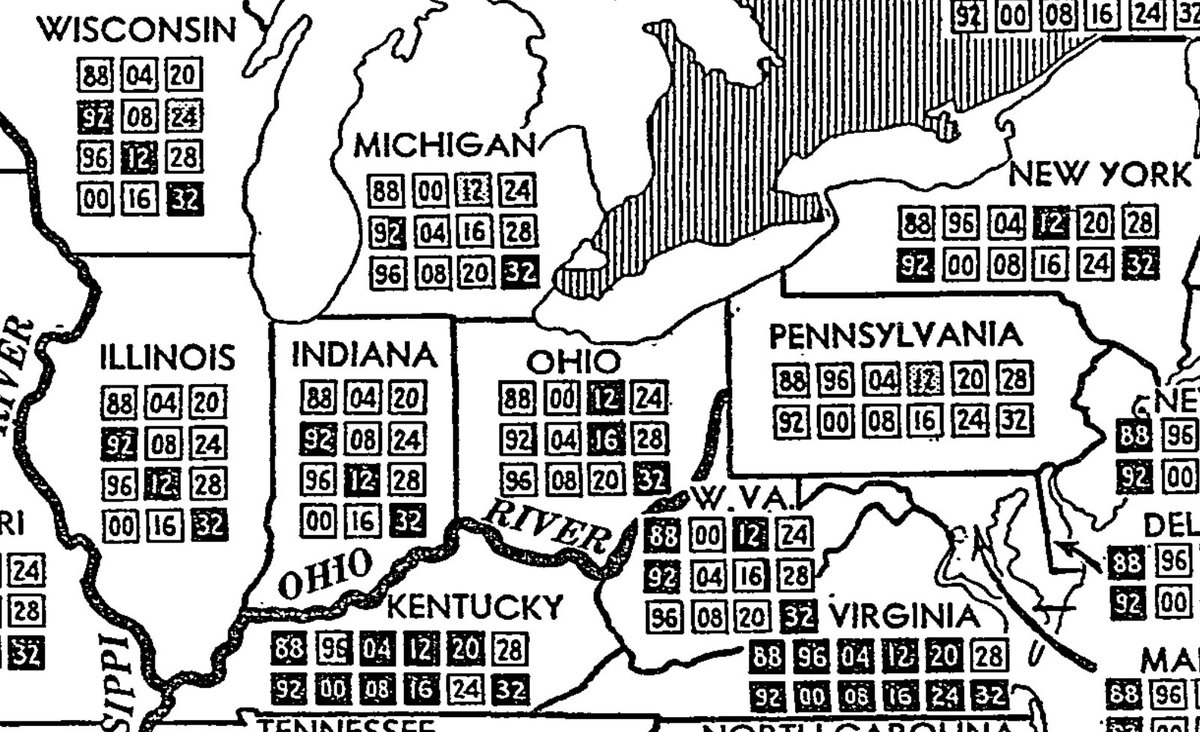
This 1932 accounting of the previous nine elections is by far the wildest pattern-filled @nytgraphics election map I've seen. Four years later they decided they'd break it down by electoral votes with lil boxes AND go TWELVE elections back!