
Gov't meteorologist part of the weather industrial complex. UNCC & NCSU Alum Opinions are my own & not a reflection of my employer

 I used a combination of many things in this forecast:
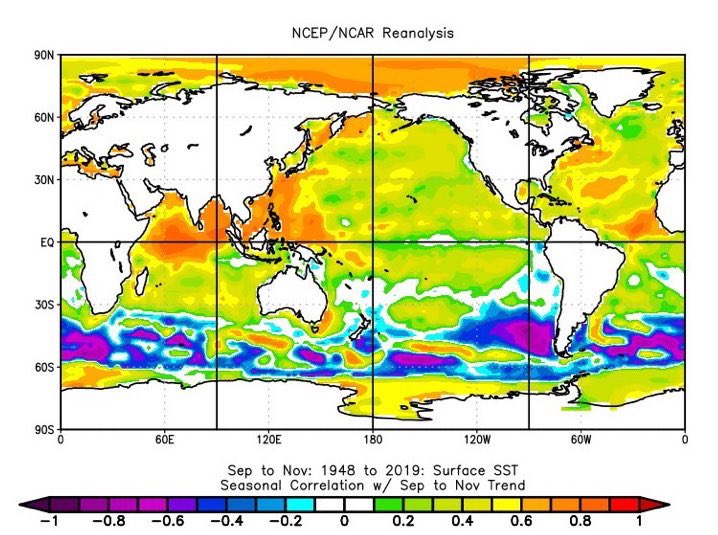
 What really catches my eye w/ this anomaly composite is how closely it resembles the long-term trends in favorable tornado environments (left figure from @gensiniwx & Brooks (2018)).


 For example, the North Indian Ocean used to be cooler during the La Nina phase of ENSO & this would help maintain a canonical ENSO -PNA pattern downstream. Warming the Indian Ocean (like this year) adds enough +U to the North Pacific Jet thru convective feedbacks to cause the anticyclonic wave breaking to occur closer to the Gulf of Alaska & US West Coast instead of the Aleutians.

 What I found pretty interesting here in one of these pieces of literature was that Maritime Continent SSTa in Nov seemed to be a good predictor for the development of the negative ABNA pattern in winter, which delivers anomalously cold air into N America.


 There's been a lot of discussion (myself included) about how far north this year's easterly waves have been lately & how this may be inhibiting TC development.


