Will Jordan Profile picture
Dem pollster. Bakersfield native.
Nov 30, 2022 5 tweets 2 min read
One cut on national turnout (vs. 2020) by looking at contested congressional districts:

* Turnout was above average in competitive districts
* Turnout was close to average in safe R seats
* Turnout was much below average in safe D seats Image What this misses: with turnout still at "only" 70-75% of 2020 in closely contested seats, plenty of slack -- it's unclear from this how much turnout (vs. vote switching) explains outcomes.
Nov 9, 2022 8 tweets 4 min read
Something I’m sure we’ll all ponder more in the coming days—exit polls have Biden approval at 44%, below Trump (45%) in 2018 exits. But approve/disapprove just mattered less this time, meaning other stuff mattered more. 
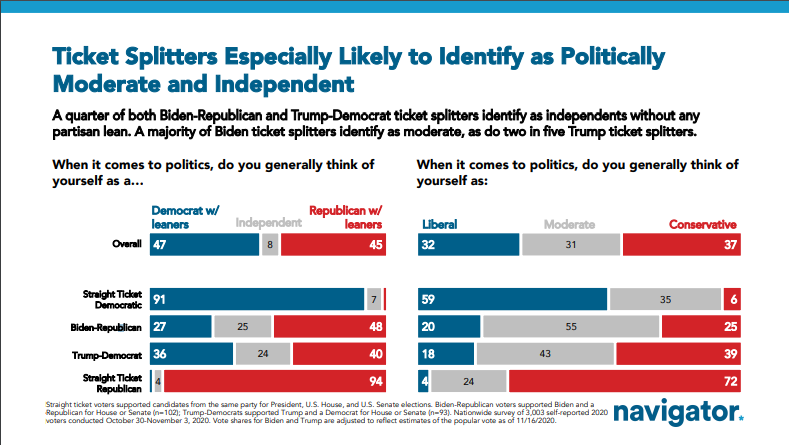
One angle: “the wave that didn’t crash.” Look at the independent vote so far:

2006 - D+18
2010 - R+18
2014 - R+12
2018 - D+13

2022 - D+2
Apr 23, 2022 8 tweets 3 min read
Debate on engagement in Culture War has me thinking about some questions from a recent survey—should Congress be focused on social/cultural issues or economic issues?

Economic issues leads by 4 to 1 margin. Voters Black, White, Hispanic, AAPI all agree under this framing. Image 
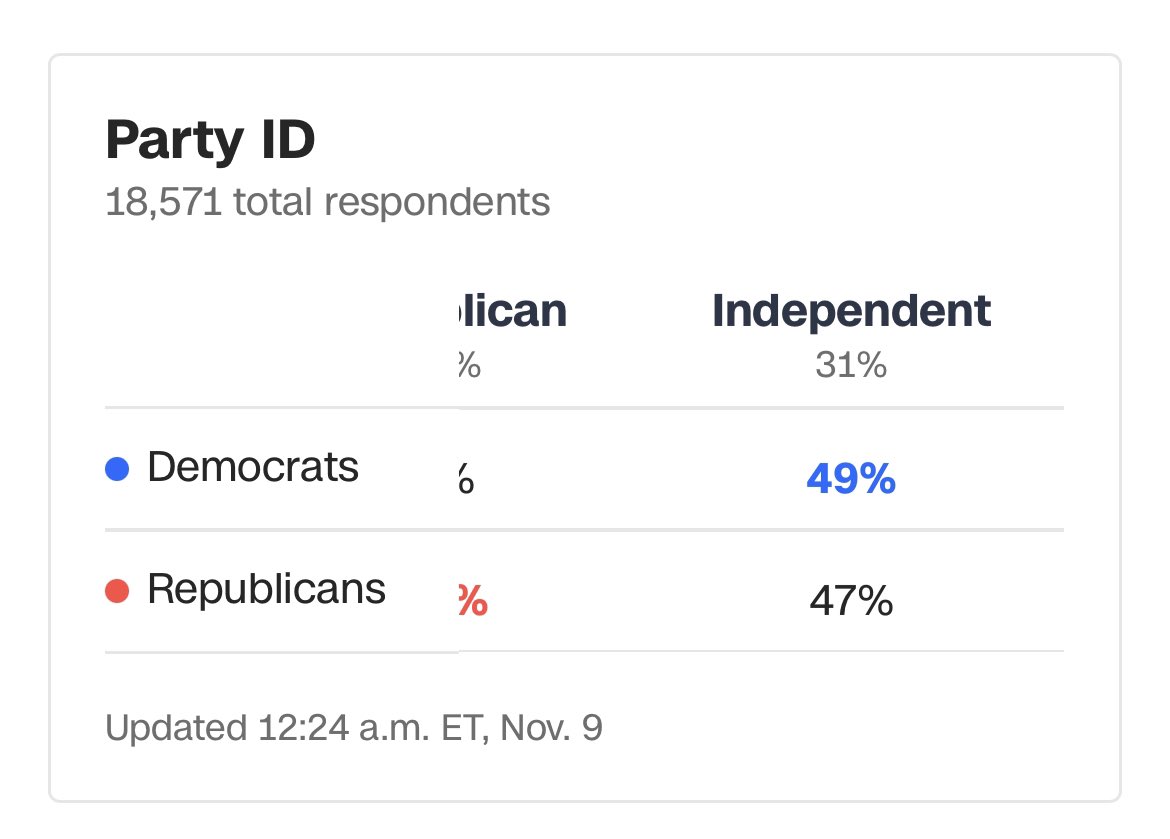
This is a thorny question to interpret, because people will have different (and overlapping) definitions of “social and cultural” and “economic.” When you ask people what the terms mean it may surprise you—“social/cultural” is diffuse. “Economic” dominated by inflation and jobs. Image
Nov 7, 2021 6 tweets 3 min read
Was curious about this...

A similar shift from Murphy 2017 (57% two-party share) or Biden 2021 (58%) to Murphy 2021 (~51%).

But Murphy's 2021 results by county "look" more like Biden 2020 than Murphy 2017 
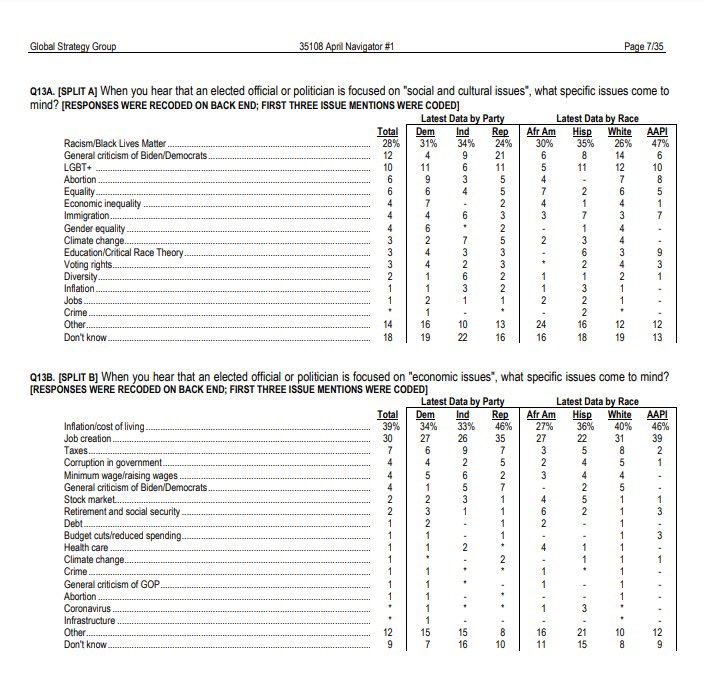
Makes sense. Though I was interested to confirm this was at least partly a "nationalized politics" story. For example, Murphy 2021 *also* looks more like 2016 presidential than 2017 gubernatorial.
Sep 24, 2021 5 tweets 2 min read
And, well, here we are lol.

NO is winning by 25 points at the moment statewide in CA (unlikely to change much) and in OC, NO is winning by 3 points (99% counted).

The "lean" of OC was 22 points to the right of the state, falling exactly between 2018 (R+23) and 2020 (R+21). The trends in Orange County during the Trump years appear fully locked in if the recall is any indication.

In 2018, Newsom got 50% in OC and 62% statewide, a 12 point gap.

In 2021, Newsom getting 52% in OC and 63% statewide...an 11 point gap. Image
Mar 6, 2021 4 tweets 1 min read
Nationscape data suggests erosion among Hispanic voters took place during the primary, rebounded somewhat after it ended. Of course, also suggests gradual gain for Trump, which is interesting to the extent he stopped talking about immigration during the campaign. One hypothesis is that as its salience faded (replaced by economy and coronavirus), his potential with Hispanic voters grew.
Mar 4, 2021 4 tweets 1 min read
Some ridiculous lies in here. The combination of no voter ID requirement and Same Day Registration would allow ppl to "to move from poll to poll and cast a number of fraudulent ballots"?

lol that is not how registration works, and combo describes current law in many places. Amazed the extent to which @PostOpinions will just let you wildly make stuff up
Feb 17, 2021 6 tweets 2 min read
New Politico poll - majorities trust teachers unions (along with school administrators and Biden) on school reopening. By 55-34, Americans think reopening should wait till teachers are vaccinated. Add it to the list
Nov 26, 2020 6 tweets 2 min read
The Biden-Clinton margin difference, vs. the Biden-Obama (2012) difference. Latter especially interesting given the similarity of the national margins. 
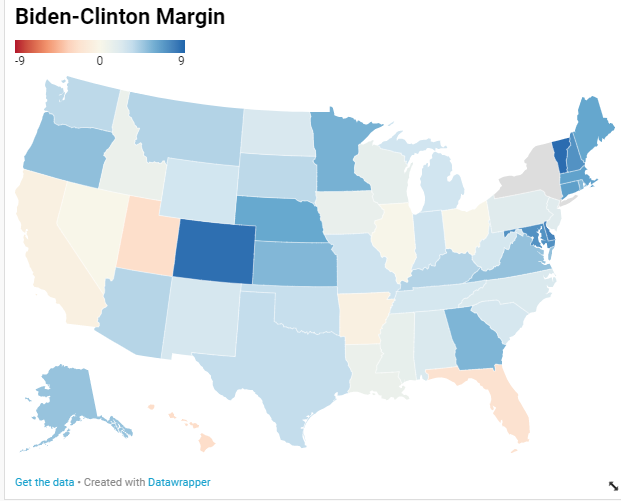
On micro story relates to something harped on before -- in 2016 and 2012 VA and CO were not really "blue" states. They were actually only a couple points to the left of national margin. But Biden cracked both open, putting them more in the place of NM, or OR circa 2012.
Nov 25, 2020 8 tweets 2 min read
Many of the Democrats who lost in 2020 were among the big surprises in 2018, and in fact they are the ones generally performing best relative to Biden (here McAdams is working with a margin 8 points to the left of Biden's). Barely not enough in quite a few places. Putting House polling aside (and the prospects of an expanded majority), if things had panned out more like the national polling -- around 4pts to the left of reality -- the picture is rapidly different in terms of W/L. There are a dozen GOPers up by <3.5pts, and 18 by <5pts.
Nov 20, 2020 4 tweets 2 min read
Looks like Indiana's 5th swung about 10 points from Trump+12 in 2016 to Trump+2 in 2020. It's always unclear how to interpret a midterm - but one thing that's become rather clear is the *relative* shifts we saw 2016-2018, regions within states and differences between states, were actually fairly informative of what we'd see in 2020. (think WI, AZ, GA, FL, IN suburbs)
Nov 20, 2020 5 tweets 2 min read
11% of Biden voters approved of Trump on the economy, which is how it was possible for Trump to lose by almost 5 points despite +5 rating on the economy.

When we asked this "conflicted" 11% whether covid or the economy was more important to their vote, it wasn't close. 
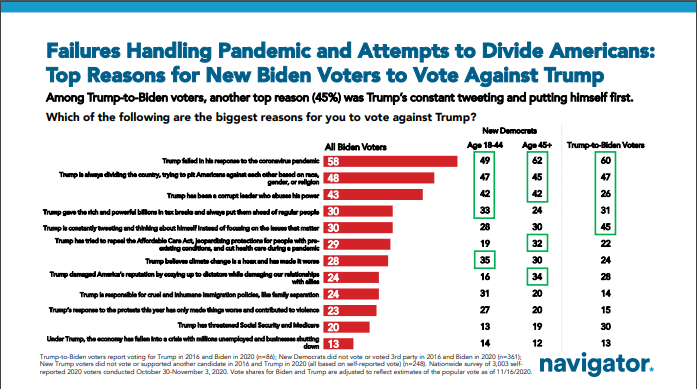
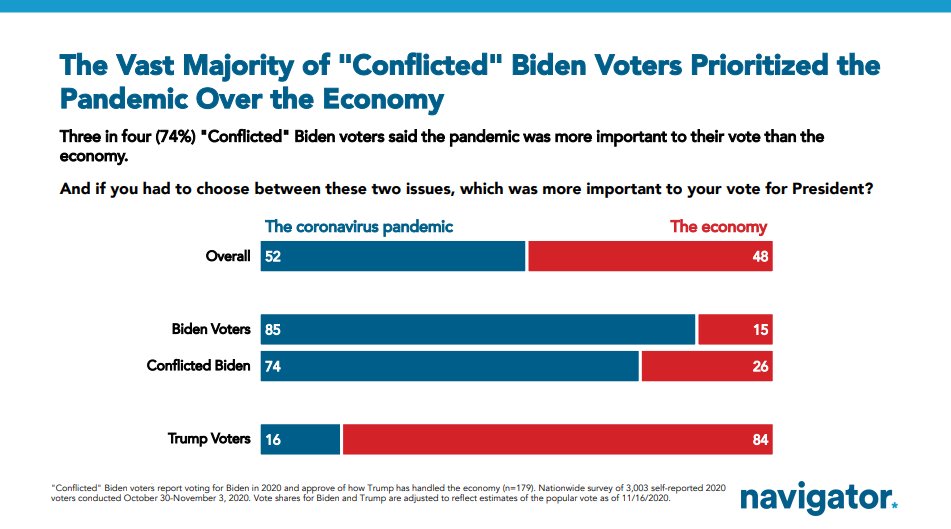
The Trump camp probably saw these voters, who approved of him on what's usually the no. 1 issue (the economy) as a key target. Maybe rightfully. But ultimately the ones who voted for Biden did not buy into the whole Trump thing despite the positivity on the economy.
Nov 19, 2020 5 tweets 3 min read
Analysis of voters who say they voted for Biden, but a Republican down ballot, via @NavigatorSurvey

- R+21 in identification
- 55% moderate
- 55% suburban
- 65% income >50k
- 71% very unfav to DJT

And
- relatively progressive on key policy debates Among a not insignificant number of voters who say they voted for Trump in 2016 but Biden in 2020, 60% cite his handling of the pandemic as the reason to vote against him.

With the larger group of "new" Dems (who didn't vote/voted 3rd party in 2016), wider issue set at play.
Nov 17, 2020 4 tweets 1 min read
Some random places where votes come in late. MS and AR have been oddballs in showing smaller turnout increases and 1-2pt growth in Trump's margin from 2016. NYT had them at >98% counted, but votes added since weekend shrunk Trump margin -0.4% in AR and -1.1% in MS. "Twyman's law' has been valuable for gut-checking partially counted results so far -- if it seemed especially unusual or interesting, it's probably wrong [not fully counted]*

*except if it's Florida
Nov 4, 2020 10 tweets 3 min read
In some cases, the final margin will look like what we have now. In others, while it may not flip the state, if these are disproportionately "late mail" for example, the remaining votes could be *very different* than what's been seen so far. And, I cannot emphasize this enough, there are as many as 5 to 6 MILLION votes yet to be counted in California alone.

An entire North Carolina yet to be posted, just in that state.
Nov 3, 2020 4 tweets 2 min read
Recognize the urge to keep looking at RCP for the historical trends and comparison, but one (small) great thing about getting through another election cycle is those trends get older and there is one more reason to ignore RCP's opaque, mysterious averages. RCP's lack of transparency, besides being just bad practice by today's data reporting standards, is frankly suspicious and makes it more plausible the aggregator is putting its thumb on the scale to help a candidate, party, or someone/thing else.
Nov 1, 2020 5 tweets 2 min read
Most of the final national polls seem to be in and Biden is at +8.6 in 538. If you apply "how red/blue was each state compared to Clinton's +2.1 in 2016?" you get:

IA: DT+3
TX: DT+2
OH: DT+2
GA: JB+1
NC: JB+3
AZ: JB+3
FL: JB+5
WI: JB+6
PA: JB+6
MI: JB+6 (Winning everything up to Georgia = 350 electoral votes for Biden)
Nov 1, 2020 4 tweets 1 min read
If Trump doesn't pull it off in the end, this will be a finding to remember when thinking about what this election was about (in the way everyone remembers how Trump won people who disliked both candidates in 2016). We talk about "swing," "independent" or "moderate" voters, but often the difference-makers are probably best called "cross-pressured."
Nov 1, 2020 4 tweets 1 min read
Amazing work by the Upshot/Siena polling team this cycle, as usual. We should all feel very lucky to have them this morning. I mean in general. Key for the “does big turnout help Biden” folks out there. This suggests: probably
Nov 1, 2020 5 tweets 2 min read
If the polls are right nationally and in Florida it suggests something fairly unusual (but foreshadowed by 2018) has happened there specifically I mean there will new not unusual explanations, but it won’t be “Florida is always close” it will be “Florida has gone from 3-4pts redder than America to 8-9 points”
Oct 31, 2020 5 tweets 2 min read
Unreal. The fast growing Travis county is at 64.74% turnout among registered voters—higher in percentage terms than 2016 (63.8%) but also higher than every other election since 1994, except juuust short of 2008 (65.05%). Before Election Day. One of the factors in turnout is competitiveness. And Texas learned at some point in 2018 it was competitive. Seems to be leaving a mark...