THREAD: SECTORAL DEEP DIVE - INDUSTRY IN 2030
Last week I highlighted key energy modelling results for 2030 in the @EU_Commission's new EU 'Long Term Strategy' and did a deep dive on Buildings. Today I want to take a closer look at the Industry Sector. 1/
Last week I highlighted key energy modelling results for 2030 in the @EU_Commission's new EU 'Long Term Strategy' and did a deep dive on Buildings. Today I want to take a closer look at the Industry Sector. 1/
https://twitter.com/andreasgraf/status/1068475415285641217
While energy industries (incl. power) and buildings have each seen emissions reductions of roughly -25% between 1990 and 2015, industrial energy-related emissions decreased significantly more in relative terms (-42%), at least until flattening out at around 2012. 2/ 

Important factors include 1) energy efficiency improvements, 2) fuel switching to biomass, 3) closure of capacity and structural shifts, and 4) deep reductions of non-CO2 GHG emissions. Energy intensity across all industrial sectors together declined by nearly 40%. 3/
Emissions from industry accounted for 20% of EU28 CO2 emissions in 2015, of which approximately 70% were energy related emissions linked to the combustion of fossil fuels and 21-30% were emissions emitted in industrial processes, such as during the production of cement. 4/


Industry accounts for 25% of final energy consumption in the EU. In absolute terms, the five largest economies in the EU (DE,FR,UK,IT,ES) together account for roughly 58% of industry energy demand. In AT/BE/FI/SE/SK industry makes up more than one-third of energy demand. 5/


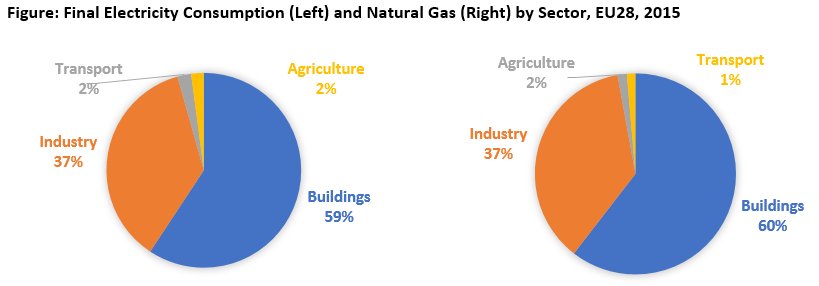
In 2012 the majority of energy demand in industry (73% or 202 Mtoe) was used for heating & cooling. The remaining 27% was mainly used for mechanical applications driven by electricity. In total, industry consumed 37% of the total heating and cooling demand in Europe in 2012. 6/

Heating in industry can be divided into low (below 200° C), medium (200°C and 500°C) and high (above 500°C) temperature levels. Processes are specific to sectors and even sub-sectors and require different temperatures ranging up to 2000°C and above. 7/


Temperature levels are an important variable, since current technical limits prevent some renewables from reaching temperatures above 200°C. Currently energy dense fossil fuels dominate the supply of heating for industry (75% in 2012), especially for medium & high temperatures 8/
Among renewables, biomass is the dominant energy source for heating in industry (9%) as it can replace fossil fuels in many applications. All other renewable sources are currently negligible (<1%). Heat pumps, solar thermal and geothermal can supply heat up to around 200°C.9/
However, significant further potential exists to 1) use excess/waste heat in industry to displace fossil fuels by exploiting synergies with district heating & cooling, as well as 2) for electrification (via heat pumps) and fuel switch to direct renewables for low temperatures.10/
In 2015, electricity and gas each accounted for around 30% of final energy consumption in industry. With non-energy uses of oil (eg chemical feedstocks), industry makes up ~20% of overall Gross Inland Oil Consumption. Coal play a stronger role in CZ, EE, PL and SK. 11/


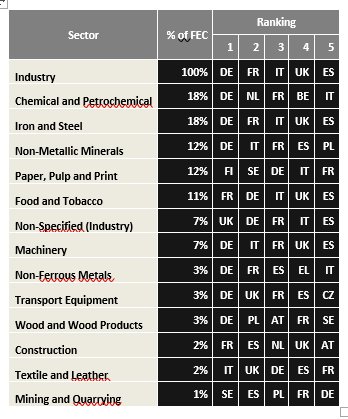
Energy intensive industry, defined as iron and steel, non-ferrous metals (e.g. aluminium, copper, lead, nickel), chemicals, non-metallic minerals (mainly cement, ceramics and glass production), and paper and pulp industries, made up 65% of industrial final energy consumption. 13/
Due to the particularly CO2 intensive nature of some of these industries, the energy intensive industry accounted for 76% of industry CO2 emissions.
Iron and Steel made up by far the largest sector category, accounting for 18% of energy consumption and 36% of emissions. 14/
Iron and Steel made up by far the largest sector category, accounting for 18% of energy consumption and 36% of emissions. 14/


Energy related industrial emissions fall both within the ETS (~75%) and the non-ETS sectors. Currently approximately 75% of emissions from this category fall under the EU ETS, especially from large and energy-intensive industrial installations. 15/
Under the ETS, companies in theory have to take into account a carbon price and are incentivized to reduce their emissions. In practice: 1) substantial free allowances are given to industrial sectors that can prove they are exposed to the risk of carbon leakage (egSteel). 16/
And 2) the EU ETS has faced extremely low prices over the last several years due to structural oversupply (€5-8 per tonne of CO2), however economic recovery, recent ETS reforms and speculation have triggered a partial recovery in the last year. 17/

The level of free allowances is set to slowly decline over time as global climate action reduces ‘carbon leakage’ risks, but only time will tell how these industry exemptions will be dealt with and what carbon price signals recent reforms of th EU ETS will bring long-term. 18/
Decarbonizing industry will require a mix of strategies until 2030: energy efficiency & resource efficiency on the demand side, fuel switching to RES & electrification on the supply side, and R&D and strategic investments into long-term deep decarbonization technology. 19/

For 2030, Commission modelling results for industry are less transparent than for other sectors, but here are some key conclusions: 1) the model projects a reduction in energy by ~10% and emissions by ~1/3, but limited emissions reductions on top of the 2016Reference Scenario 20/

2) This is largely due to key assumptions about the development of the economy and efficiency improvements. The 2016 Reference Scenario assumes decoupling and a recovery of economic activity with stronger growth in the less energy-intensive service sector (rising to 76%). 21/


In parallel, industrial energy demand is assumed to decline due to: A) replacement of old equipment with more efficient technology and B) structural changes in industrial activity which shift industry towards higher value added and less energy-intensive production processes. 22/

3) A partial fuel switch also takes place towards less carbon intensive fuels. Fossil fuels decline moderately due to regulation, new equipment (eg industrial boilers), the ETS and fossil fuel prices, while a modest increase in RES is largely covered by biomass and waste. 24/


4) Electrification of processes has a high potential in some industries by 2050, incl. the chemical sector (electrochemical processes) and the iron & steel sector (electrolysis steel, electric arc), but electricity consumption is projected to increase only slightly by 2030. 24/

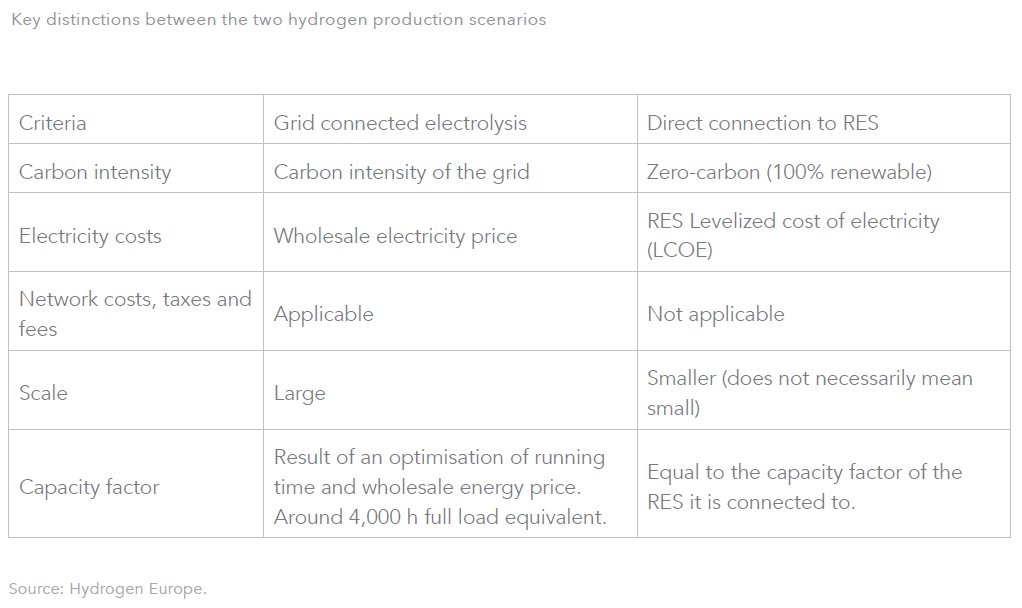
5) Finally, key low-carbon innovations (eg. direct reduction of iron) and technologies (eg. electrolyzers), which should become commercialised by 2030 to allow for timely scaling and deployment across the EU by 2050, do not factor in the Commission modelling for 2030. 25/
These figures highlight what I mean by "do not factor". The Baseline Scenario which continues 2030 policies out to 2050, and hence largely avoids transformational change, leads to barely any consumption of green hydrogen and e-gas in industry, even in a 2050 perspective.


And now for the more readable version. @threadreaderapp please unroll.
• • •
Missing some Tweet in this thread? You can try to
force a refresh