One of the more interesting aspects of this very informative new @H2Europe report is its analysis comparing the cost of producing renewable hydrogen for electrolysis projects connected to the grid vs islanded systems with direct connection of renewables.
https://twitter.com/H2Europe/status/1314230705786941442
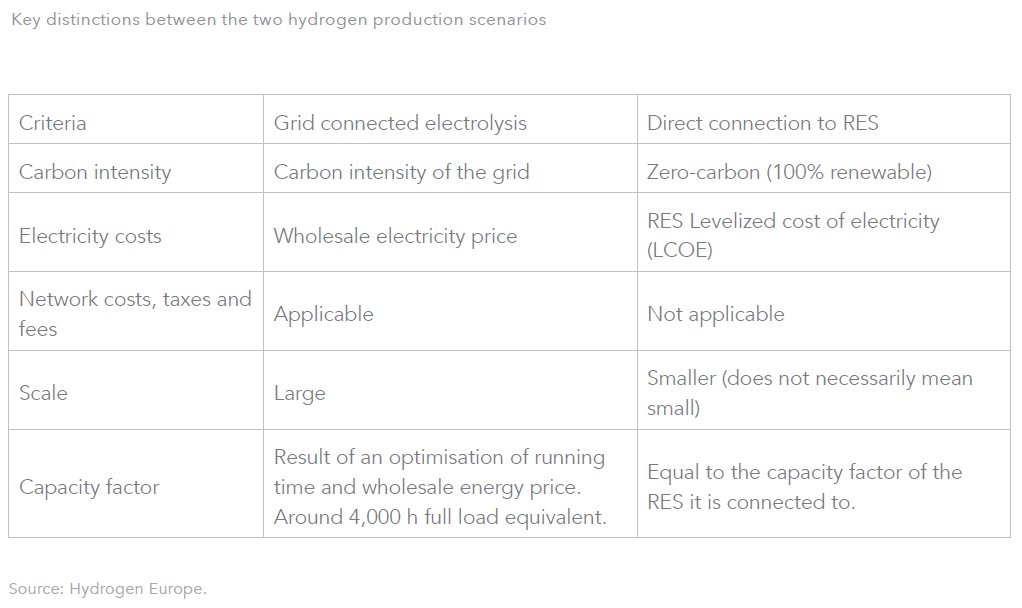
This table provides an overview of the two schematic production scenarios. For both scenarios, key techno-economic parameters of the electrolysis were adopted based on current state-of-the-art 10,000 kW alkaline electrolysis. 
For 2019, the study estimates that production costs using grid electricity in the EU (together with Norway and the UK) are in the range of €2.6 – 9.5/kg, with the average for all countries being €4.7/kg and a median of €4.2/kg.

Costs are highest in Denmark (€8.5 / kg), Cyprus (€8.5/ kg) and Germany (€7.4/kg). They are lowest in Sweden (€3.2/ kg), Norway, Finland (€3.4/kg) and Luxemburg (€2.6/kg).
One of the main reasons for the differences in hydrogen production costs for Denmark and Germany are high taxes charged on top of the wholesale electricity price. E.g. electricity taxes are responsible for 2/3 of total hydrogen production costs, in Denmark and 1% in Luxembourg.

Luxemburg is also a good example of why these costs do not well represent overall system costs. While Luxembourg enjoys low wholesale electricity prices, thanks to high penetration of
cheap renewables in Germany, most of the balancing costs are being borne by the German end-users
cheap renewables in Germany, most of the balancing costs are being borne by the German end-users
The analysis basis its cost calculations on the assumption that the electrolyser would run for on average around 4,000 hours per year, in off-peak hours, when the electricity price is the lowest, which is considered close to optimum for most EU countries.
Here the study provides interesting analysis on the trade-offs between the number of operating hours of the electrolyser, the impact of CAPEX on final hydrogen production costs and the cost of electricity.


But here it starts getting complicated, because not all grids are the same with regards to carbon intensity. This figure shows that the average emissions intensity by country ranges from 0 kgCO2/kgH2 in Iceland to 46.1 kgCO2/kgH2 in Estonia, as a function of the electricity mix.

In some countries, including Norway, Sweden, Latvia, Lithuania, Luxembourg and France, the carbon intensity of grid electricity is low enough that the produced hydrogen’s carbon footprint would be low enough to meet all hydrogen emission benchmarks set at the EU level.
By contrast, in 19 EU member states the production of hydrogen from grid electricity, including also the average EU-27 energy mix, would be more carbon intensive than fossil hydrogen from Steam Methane Reforming (SMR) without CCS (commonly referred to as “grey” hydrogen).
Production of hydrogen using the EU-27 average electricity mix would result in emissions of 14.8 kgCO2/kgH2.
So how does the cost of hydrogen production with a direct connection to a renewable energy source compare to grid connected hydrogen production? It must be more expensive, no? That's why projects want to connect to the grid, right? Well, in many cases, the answer is: nope.
The costs of renewables have come down dramatically over the last decade. Now factor in all of those grid fees and taxes you can save and - voila - estimated renewable hydrogen production costs with direct connection varying from €3.5/kg (Portugal) to €6.5/kg (Luxemburg).

Based on average wind and solar conditions for each country the cheapest pathway to green hydrogen production in Southern Europe is solar PV, while in Northern Europe in most cases it is onshore wind, with the exception of Belgium and Germany (offshore wind).
However, there are also areas with significantly better than average wind or solar conditions, where production of renewable hydrogen with direct connection to the RES source would also be significantly less expensive than the average.
Thus, while renewable hydrogen production costs are in most countries still 2-3 times higher than fossil hydrogen produced via steam reforming without CCS (€1.5 – 2.0 EUR/kg),.renewable hydrogen production costs in the EU can be as low as €2.9/kg (PV in South of Europe).

Moreover, in large countries like Germany average RES potential can be particularly misleading as there are areas with significantly better than average wind or solar conditions, the low in the German example, estimated at €3.5/kg.
Further cost reductions can be achieved by downscaling the electrolyser compared to the RES it is connected to and feeding only the 'excess renewable electricity' from the islanded grid back into the main grid, or finding some other use for it.
By optimizing the electrolyser capacity to the renewable electricity production, and not the other way around, the capacity factor can be significantly increased, potentially improving the economics of the project.

Taking advantage of this optimization strategy could drive the costs of green hydrogen low enough for it to be cost-competitive with grey hydrogen... today... That's right folks. You heard me right.
Using the example of Spain, the @H2Europe study finds that with a electrolyser-to-RES power ratio of 0.35 or below for solar PV or 0.2 or below for onshore wind renewable hydrogen production costs would fall below €2.0 EUR/kg.

So where does this leave us? Well, in short, far from a business case for 40 GW of electrolyser capacity in Europe, as aimed for in the EU Hydrogen Strategy, and with significant sustainability risks for grid-connected hydrogen production in a number of Member States.
Sure, based on these calculation some sustainable renewable hydrogen production can under certain circumstances already compete with fossil hydrogen without CCS even today.
But with an average currently between €5-6/kg, it is also clear that significant State Aid will needed to commercialize this technology. A BNEF Study from March estimated cumulative subsidies to 2030 of $150 billion.

So the question then becomes: How do we want to develop those support policies and what conditions should we apply to this State Aid? For example, should we really focus on State Aid in the form of reduced taxes and levies in grids with a high CO2 intensity?
How will we ensure that the renewables that are used for renewable hydrogen production are also actually coming additional renewables being added to the system, and not existing renewables being diverted to new end-uses or, worse still, simply higher fossil production?
These are important questions that must be satisfactorily be answered, and not simply pesky nuisances for project developers as the @H2Europe study occasionally implies (poor judgement).

And even where a favourable regulatory environment could allow for a business case for renewable hydrogen when other costs are socialized (e.g. avoided energy taxation used to fund road maintenance that diesel/petrol users would pay), a robust sustainability framework is needed.

Luckily, there are a lot of opportunities in the coming months and years for regulators to ensure that the EU fully lives up to the promise of the Clean Hydrogen Economy, both in terms of its implied (but not guaranteed) climate benefits and its economic opportunity.

These range from the upcoming reforms of the EU ETS and the RED II, to ongoing processes around defining the sustainability of transport fuels, project selection in the Innovation Fund and EU Recovery Plan, or even upcoming State Aid Guidelines.
The EU Hydrogen Strategy goals are extremely ambitious. But that is what is called for given the climate crisis. To make it a success we need a robust, enabling environment encouraging investment, not stifling it. But we also need the right kind of investment, not short-cuts.
• • •
Missing some Tweet in this thread? You can try to
force a refresh