
#Chapter2 : Trend Trading .
Traders first priority is to take a trade basis the trend. Trend in simple terms means, following the direction of the Market.
Which also means, being with the forces who create the direction, who drive the prices, who move the market, SmartMoney.
Traders first priority is to take a trade basis the trend. Trend in simple terms means, following the direction of the Market.
Which also means, being with the forces who create the direction, who drive the prices, who move the market, SmartMoney.
What is Smart Money ?
Traders Small or Big who buy or sell in large quantities and have the money power to play with prices by buying or selling at important price points.
They decide if the Price is Undervalued for a Buying Opportunity or Over Valued for Selling Opportunity.
Traders Small or Big who buy or sell in large quantities and have the money power to play with prices by buying or selling at important price points.
They decide if the Price is Undervalued for a Buying Opportunity or Over Valued for Selling Opportunity.
As the Buying or Selling happens in Bulk, their Profitability depends on How far they can push the price, so that they can cover whole of their orders with out loosing much.
They have the power to hold positions and keep rolling it over for Years or Decades if they decide to do.
They have the power to hold positions and keep rolling it over for Years or Decades if they decide to do.
Please remember SmartMoney doesn’t buy / sell at all Price Points, they get their buying or selling orders executed only at Key Support or Key Resistance Levels.
Hence, when we see Support or Resistance breaking, we see BIG movement in Prices, as it triggers their SL.
Hence, when we see Support or Resistance breaking, we see BIG movement in Prices, as it triggers their SL.
Trend is divided in to 3 broad categories:
1. Short Term Trend
2. Medium Term Trend
3. Long Term Trend.
Short Term is upto 20 Days
Medium Term is upto 100 Days
Long Term is above 200 Days.
One can also plot the same on Daily, Weekly and Monthly time frame.
1. Short Term Trend
2. Medium Term Trend
3. Long Term Trend.
Short Term is upto 20 Days
Medium Term is upto 100 Days
Long Term is above 200 Days.
One can also plot the same on Daily, Weekly and Monthly time frame.
As a trader you must have noticed that we see a Sudden sell off of 300-500 points and all retail jump into selling, but suddenly the market moves in opposite direction.
Hence as a retail its important to know “ What Trend Are We In - Basis that you should plan your trade."
Hence as a retail its important to know “ What Trend Are We In - Basis that you should plan your trade."
Knowing that the Trend is Divided in to 3 Broad Time Based Category, Each Time based category is again broadly divided into 3 categories :
1. UpTrend
2. DownTrend
3. No Trend / RangeBound / Flat
1. UpTrend
2. DownTrend
3. No Trend / RangeBound / Flat
UpTrend Image: 

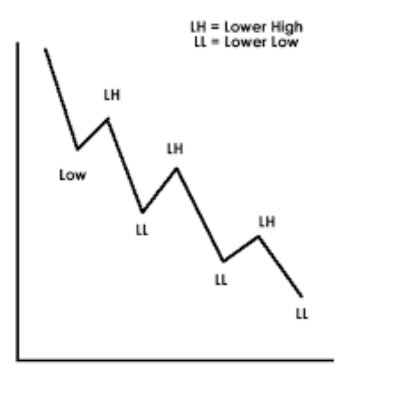
DownTrend Image:
Flat or RangeBound Image:

Always remember, You Never Trade Against the Trend. The Above images / charts are communicating to the trader that they are UP / Down / Flat but not many read that.
Charts only speak the language of Direction - Hence EYES are Weapons of a Trader. See What It Tells You and Act.
Charts only speak the language of Direction - Hence EYES are Weapons of a Trader. See What It Tells You and Act.
Trading Against the Trend is SUICIDE. Its like running in the direction of a train which is coming towards you.
Uptrend does not mean selling will not come or Downtrend does not mean rally will not come.
After all Trading is about Demand and Supply - Power to Pull or Push.
Uptrend does not mean selling will not come or Downtrend does not mean rally will not come.
After all Trading is about Demand and Supply - Power to Pull or Push.
As a Trader your Job is to First Find the Trend, then Find the Range and then decide the Trade.
Next question which will come to ones mind is HOW DO I FIND the TREND ?
There are 3 ways in which one can find a Trend:
1. Simple M A
2. Exponential M A
3. Weighted M A
I use #EMA
Next question which will come to ones mind is HOW DO I FIND the TREND ?
There are 3 ways in which one can find a Trend:
1. Simple M A
2. Exponential M A
3. Weighted M A
I use #EMA
#NoteToAll:
We Never Sell in an Uptrend, We wait for the Dip to Buy.
We Never Buy in a DownTrend, We wait for the Rally to Sell.
We avoid taking trades in Flat or No Trend Markets.
We Never Sell in an Uptrend, We wait for the Dip to Buy.
We Never Buy in a DownTrend, We wait for the Rally to Sell.
We avoid taking trades in Flat or No Trend Markets.
Traders who trade against the trend get caught on the wrong foot and when their SL is taken, they run like the Dogs on Streets Chasing a Car or a Vehicle. Dogs change them as they feel that some one else is taking away what belongs to them.
Traders who Follow Trend are Known as Trend Traders and they are mostly long term positional traders.
Traders who find Trend with in a Trend even on 1 minute charts are known as Price Action Traders.
Remember this difference, it will save a lot of Money.
Traders who find Trend with in a Trend even on 1 minute charts are known as Price Action Traders.
Remember this difference, it will save a lot of Money.
#Exponential Moving Averages:
The exponential moving average (EMA) is a weighted moving average (WMA) that gives more weighting, or importance, to recent price data than the simple moving average (SMA) does. The EMA responds more quickly to recent price changes than the SMA.
The exponential moving average (EMA) is a weighted moving average (WMA) that gives more weighting, or importance, to recent price data than the simple moving average (SMA) does. The EMA responds more quickly to recent price changes than the SMA.
Moving Average Ribbons: Traders use moving averages in devising their trading strategies. They do this via moving average ribbons, which plot a large number of moving averages onto a price chart.
Though seemingly complex based on the sheer volume of concurrent lines, ribbons create an effective and simple way of visualizing the dynamic relationship between short-, intermediate- and long-term trends.
Traders and analysts rely on ribbons to identify turning points, continuations, overbought/oversold conditions, to define areas of support and resistance, and to measure price trend strengths..
Defined by their characteristic three-dimensional shape that seems to flow and twist across a price chart, moving average ribbons are very simple to create and interpret. They generate buy and sell signals whenever the moving average lines all converge at one point.
Traders look to buy on occasions when shorter-term moving averages cross above the longer-term moving averages from below, and look to sell when shorter moving averages cross below from above.
Term: Cross Over and Cross Down to be remembered.
Term: Cross Over and Cross Down to be remembered.
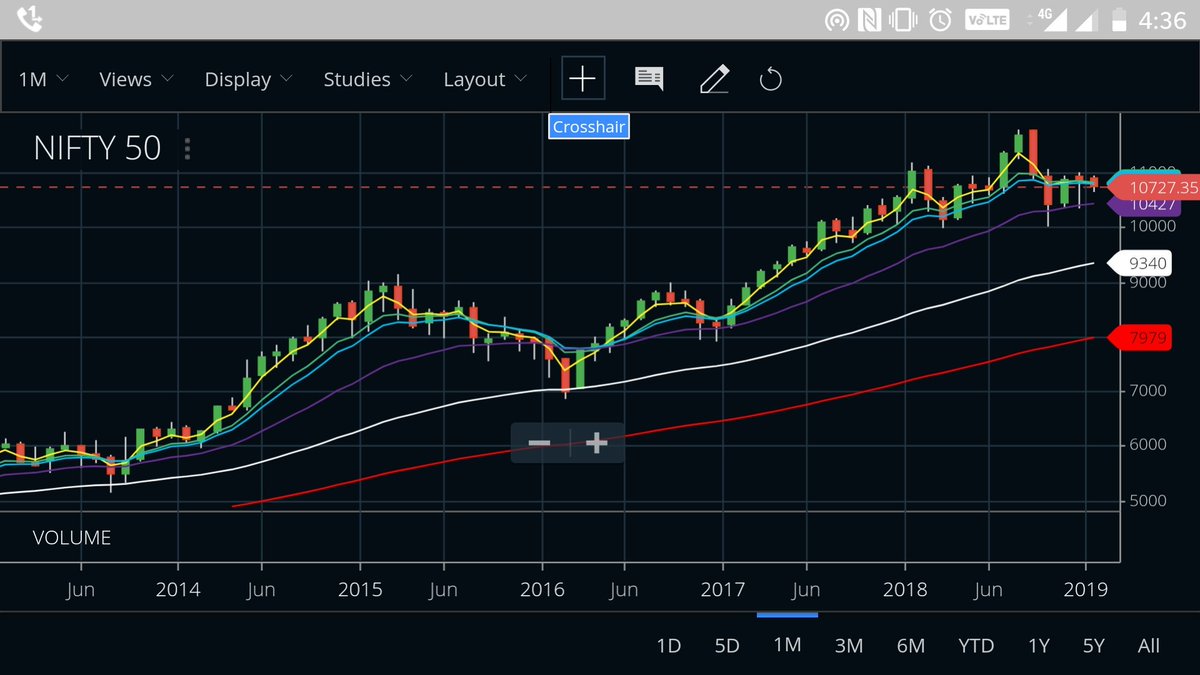
#Nifty Monthly Chart with #EMARibbons . This is how a simple.chart with EMA looks. Simple visualise, understand and interpret.
Which EMA’s to Use ? Now its a choice of the trader to decide which EMA’s to use, but my 18 months of Visual Experience made me follow the below;
3
7
9
20
50
100
200
I decide which one to use when and we will cover the same in below tweets.
3
7
9
20
50
100
200
I decide which one to use when and we will cover the same in below tweets.
Day Trading: As a day trader our requirement is to get the best trade for the day.
I use all of the above EMA, as even a Day trader should know the over all trend before taking a trade on shorter time frames.
3, 7, 9, 20, 50, 100, 200.
I use all of the above EMA, as even a Day trader should know the over all trend before taking a trade on shorter time frames.
3, 7, 9, 20, 50, 100, 200.
How does one Know if the Price will Go up or Go Down ?
Please remember, EMA Trading is like playing “Snake and Ladder Board Game” - A Player moves ahead if he jumps the Snake / get a ladder and Comes Down If the Snake Bites.
Even EMA Moves in the similar direction.
Please remember, EMA Trading is like playing “Snake and Ladder Board Game” - A Player moves ahead if he jumps the Snake / get a ladder and Comes Down If the Snake Bites.
Even EMA Moves in the similar direction.
Rules of EMA and Price Movement:
1. Short Time Frame EMA has to Cross Over Long Time EMA - 3 Cross Over 7 or 20 Cross Over 50 Cross Over 200 - UPTREND.
2. Short Time Frame EMA Cross Down Long Time Frame EMA - 3 Cross Down 7, 20 Cross Down 50 , 50 Cross Down 200 - Down Trend.
1. Short Time Frame EMA has to Cross Over Long Time EMA - 3 Cross Over 7 or 20 Cross Over 50 Cross Over 200 - UPTREND.
2. Short Time Frame EMA Cross Down Long Time Frame EMA - 3 Cross Down 7, 20 Cross Down 50 , 50 Cross Down 200 - Down Trend.
Key Rule to Remember:
Golden Cross
Death Cross.
Golden Cross: This happens when 50 Day EMA Crosses Over 200 Day EMA post a Down Trend
Death Cross : This happens when 50 Day EMA Crosses Down 200 Day EMA Post an Up Trend.
This is used during the Long Term Trend Identification.
Golden Cross
Death Cross.
Golden Cross: This happens when 50 Day EMA Crosses Over 200 Day EMA post a Down Trend
Death Cross : This happens when 50 Day EMA Crosses Down 200 Day EMA Post an Up Trend.
This is used during the Long Term Trend Identification.
#ImportantRule: 3 Cross Over 7 is Bullish and 3 Cross Down 7 is Bearish.
Never forget this Rule.
Here we End Trend Identification Subject, Now we will cover Range Identification post which we will look at Entry, SL and Exit using Charts.
Never forget this Rule.
Here we End Trend Identification Subject, Now we will cover Range Identification post which we will look at Entry, SL and Exit using Charts.
#SupportandResistance:
How to Find Key Levels to see the Actions of SMARTMONEY ?
Please Remember, SmartMoney Just doesnt BUY, they Do Sell. They Sell at a Particular level and come to Cover or Fresh Buy only at a Particular Price Point and Not before That.
How to Find Key Levels to see the Actions of SMARTMONEY ?
Please Remember, SmartMoney Just doesnt BUY, they Do Sell. They Sell at a Particular level and come to Cover or Fresh Buy only at a Particular Price Point and Not before That.
How does Support and Resistance gets Created ?
Any Area where there is Consolidation for couple of days - Its an area where Buyer and Sellers Fight in a Range. Check the Eclipse areas in the Chart. When Price Stays in a Tight range, it creates a Key Price Point for future.
Any Area where there is Consolidation for couple of days - Its an area where Buyer and Sellers Fight in a Range. Check the Eclipse areas in the Chart. When Price Stays in a Tight range, it creates a Key Price Point for future.
How do we Know if Its a Key Support or a Key Resistance ?
A Strong resistance is followed by a BIGRed candle, every time Bulls try to Break that during a rally & a Strong Support is where the Price dips below the level, but Close is above the mark and followed by Big Green candle
A Strong resistance is followed by a BIGRed candle, every time Bulls try to Break that during a rally & a Strong Support is where the Price dips below the level, but Close is above the mark and followed by Big Green candle
So if you observe the Eclipse and Arrows you will get an idea on what i am talking about. Every time Price has hit the major Support level, SmartMoney gave a BIG Green Candle the following Day and Vice Versa.
You should also make a note of the Volume at the Key Support or Resistance Levels. As a Retail Trader, if you have this basic understanding, then all you do is always wait for the Key levels to hit and follow what Smart Money does. The forces will be with your trade.
In a Month, the Price will make multiple attempts to between the support and resistance and as a retail trader you should be looking at taking trades only at those level and not in between. If take trades every day, then they will only do CHOP CHOP - Your SL will always be taken.


#EMATradingStrategies:
This section we will discuss on how should One use EMA and what are the rules which governs EMA movement.
The Universal rule for EMA usage for Day or Short Term Traders is :
3 , 7, 9 and 20
Application can be On any time frame : 1, 3, 5, 10, 15, 30, 60
This section we will discuss on how should One use EMA and what are the rules which governs EMA movement.
The Universal rule for EMA usage for Day or Short Term Traders is :
3 , 7, 9 and 20
Application can be On any time frame : 1, 3, 5, 10, 15, 30, 60
As a Day Trader, I use 15, 30, 60 Minutes and 1 Day Chart and apply 3, 7 and 9 and 20 or 50 EMA depending on Volatility.
During high VIX I use 50, 100 and 200 as the swings could be deep and during Low VIX I restrict it to 3,7,9 and 20 EMA.
During high VIX I use 50, 100 and 200 as the swings could be deep and during Low VIX I restrict it to 3,7,9 and 20 EMA.
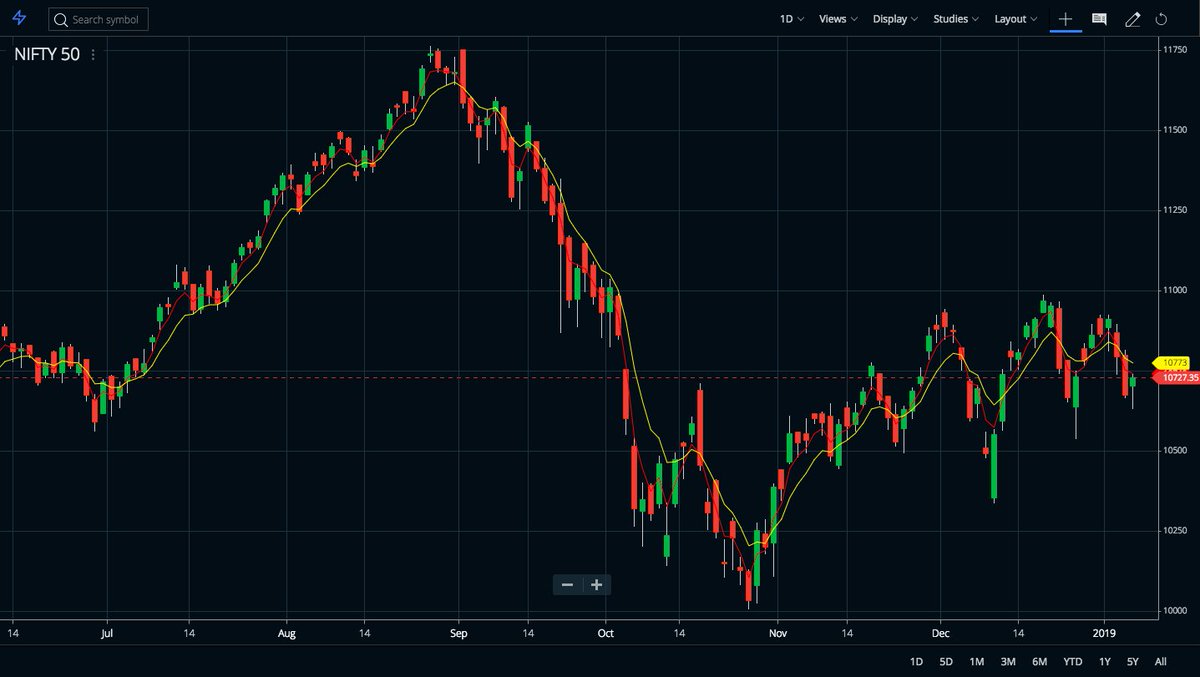
#Chart1: Nifty Daily - Below chart one can see 3 EMA (Red) and 7 EMA (Yellow) Every time the Red Crosses Over 7 - We see Price Moving Up and When It Crosses Down 7 - We See Bearishness.
Uptrend - 3 is Support and Down Trend 3 Becomes Resistance.
Uptrend - 3 is Support and Down Trend 3 Becomes Resistance.

#Chart2: Day Trading Set-Up: On Zerodha I get an Option to see 4 Charts in a single screen. Hence for day Trading I use 4 Chart Screen - Daily, Hourly, 30 Mins and 15 Mins with 3 and 7 EMA Shown in the below image
This helps me in Identifying the Max Upside and DownSide in a day
This helps me in Identifying the Max Upside and DownSide in a day

Rules of EMA:
As mentioned earlier, #EMA follow the Snake and Ladder Game Theory when in practice.
Every Time 3 EMA does a Cross Over of 7 EMA on a Particular Time Frame, the Current Time Frame 7 Becomes a Strong Support and Resistance comes at 3 EMA of Next Time Frame.
As mentioned earlier, #EMA follow the Snake and Ladder Game Theory when in practice.
Every Time 3 EMA does a Cross Over of 7 EMA on a Particular Time Frame, the Current Time Frame 7 Becomes a Strong Support and Resistance comes at 3 EMA of Next Time Frame.
To Simplify the same:
15 Mins 3 Cross over 7 = 30 Mins 3 Cross Down of 7.
30 Mins 3 Cross Over of 7 = 60 Mins 3 Cross Down Over 7
60 Mins 3 Cross Over 7 = Daily 3 Cross Down 7 EMA.
Daily 3 Cross over 7 = Weekly 3 Cross Down 7
Weekly 3 Cross over 7 = Monthly 3 Cross Down 7
15 Mins 3 Cross over 7 = 30 Mins 3 Cross Down of 7.
30 Mins 3 Cross Over of 7 = 60 Mins 3 Cross Down Over 7
60 Mins 3 Cross Over 7 = Daily 3 Cross Down 7 EMA.
Daily 3 Cross over 7 = Weekly 3 Cross Down 7
Weekly 3 Cross over 7 = Monthly 3 Cross Down 7
The above is the reason why we get a chart like below when we plot a line graph for an uptrend or a down trend Index.


When you plot 3 and 7 on any chart and monitor them on a real time basis, you will get the above image for price movement.
In Bullish markets they will make HH and HL and in Bearish Markets they will make LL and LH.
Logic: 3 Cross over 7 hits the next time frames 3 and returns
In Bullish markets they will make HH and HL and in Bearish Markets they will make LL and LH.
Logic: 3 Cross over 7 hits the next time frames 3 and returns
Hence,In Day Trading it becomes really important that First You find the Over all Trend, Then the Range for the Day basis Support and Resistance and Just wait for the Best Move to Come - The Best Trade comes when it hits 3 Cross Over 7 in an Uptrend or 3 Cross Down 7 in Downtrend
EMA Trend Identification: A Stock or an index where you see 3 DEMA Cross Over 7 - is in a Short Term Uptrend.
3 WEMA Cross Over 7 WEMA is Medium Term Uptrend.
3 MEMA Cross Over 7 MEMA is Long Term Uptrend.
Reverse Holds Good When 3 Cross Down 7 on Daily, Weekly and Monthly.
3 WEMA Cross Over 7 WEMA is Medium Term Uptrend.
3 MEMA Cross Over 7 MEMA is Long Term Uptrend.
Reverse Holds Good When 3 Cross Down 7 on Daily, Weekly and Monthly.
Lets look at an Example:
Reliance Cash Market Chart Movement:
Monthly 3 Cross Over 7
Weekly 3 Cross Down 7
Daily 3 Cross Down 7
Reliance Cash Market Chart Movement:
Monthly 3 Cross Over 7
Weekly 3 Cross Down 7
Daily 3 Cross Down 7


If you look at the Closing Price on a Monthly Chart, you will find that the Price invariably comes and takes support at 9 MEMA.
So if you start using 20, 50 EMA - Then you get to know the Support.
So if you start using 20, 50 EMA - Then you get to know the Support.
Thumb Rules:
EMA follows certain rules for Uptrend and DownTrend Confirmations.
1. It always follows a sequence of Cross Over or Cross Down.
In an Uptrend Market Fast Moving Avg (Short time frame) gives Push Up to Prices and Lower Time Frame acts as strong support.
EMA follows certain rules for Uptrend and DownTrend Confirmations.
1. It always follows a sequence of Cross Over or Cross Down.
In an Uptrend Market Fast Moving Avg (Short time frame) gives Push Up to Prices and Lower Time Frame acts as strong support.
In a Down Trend - First Line of Resistance is Fast Moving EMA and Second or Last Line of Resistance is Slow Moving EMA.
3 Is Fast 7 is Slow
7 Is Fast - 9 is Slow
9 Is Fast - 20 is Slow
20 Is Fast - 50 is Slow
50 Is Fast - 100 is Slow
100 Is Fast - 200 is Slow
You get this.
3 Is Fast 7 is Slow
7 Is Fast - 9 is Slow
9 Is Fast - 20 is Slow
20 Is Fast - 50 is Slow
50 Is Fast - 100 is Slow
100 Is Fast - 200 is Slow
You get this.
#Chart: Nifty Daily with Max 50 EMA (White Line) - 3, 7, 9, 20 and 50.
In Sep when Nifty Fell, from that time 50 EMA While Line is Above acting as resistance and Before Sep 50 EMA While Line was Support - below the Candles.
In Sep when Nifty Fell, from that time 50 EMA While Line is Above acting as resistance and Before Sep 50 EMA While Line was Support - below the Candles.

#Chart: Daily Chart of Nifty with explanation on How a Slow Moving Avg acts as Support on Cross Over and How it Acts as a Resistance Post Cross Down.
Simple 3 and 7 EMA. (Red and Yellow)
Simple 3 and 7 EMA. (Red and Yellow)
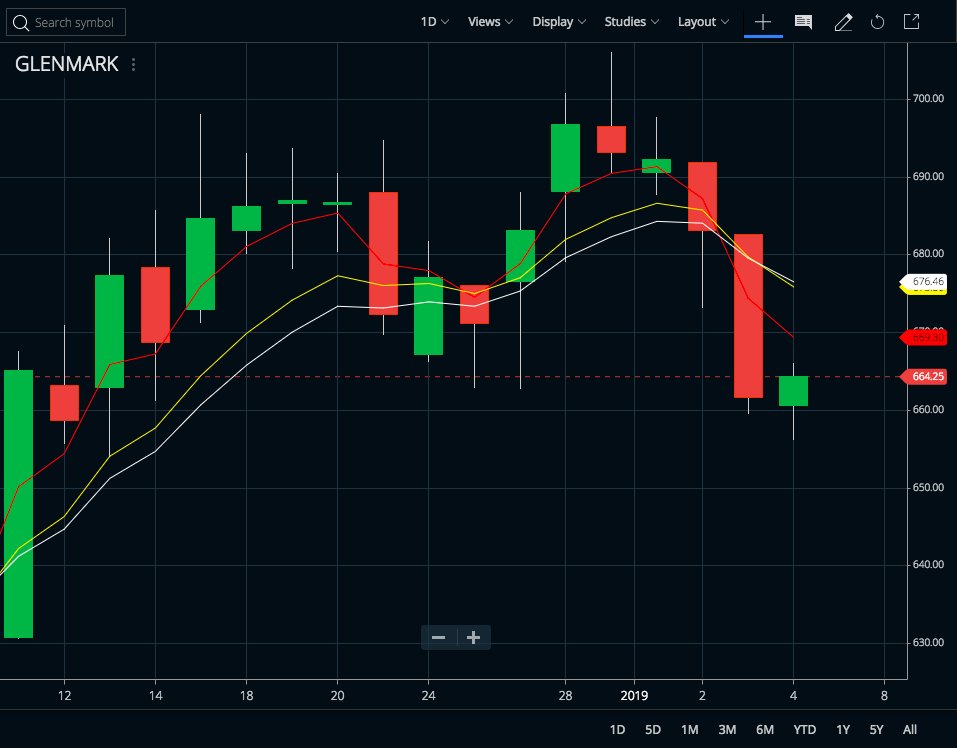
#ChartExample 2: Glenmark Pharma:
Monthly 3 Cross Over 7
Weekly 3 Cross Over 7 &
Daily 3 Cross Down 7
So on a daily chart it is Bearish
Weekly Its Still Bullish
Monthly Its Highly Bullish
Monthly 3 Cross Over 7
Weekly 3 Cross Over 7 &
Daily 3 Cross Down 7
So on a daily chart it is Bearish
Weekly Its Still Bullish
Monthly Its Highly Bullish


Remember the below Rule as a Trend / Price Trader:
We always take trades which are best trades. Where we Know Our Entry, Our Exit and Our SL.
If a Stock is 3 Cross Over 7 On Monthly or Weekly then Its in Uptrend and the fall is Created only to get the orders filled.
We always take trades which are best trades. Where we Know Our Entry, Our Exit and Our SL.
If a Stock is 3 Cross Over 7 On Monthly or Weekly then Its in Uptrend and the fall is Created only to get the orders filled.
A Stock will be considered Bearish only when 3 MEMA Crosses Down 7 MEMA - Then you have a license to SHORT this Stock.
A Stock will be Considered Bullish when 3 MEMA is Cross Over 7 MEMA.
You have to look for Opportunity to Buy the Stock when it comes down on Daily or Weekly.
A Stock will be Considered Bullish when 3 MEMA is Cross Over 7 MEMA.
You have to look for Opportunity to Buy the Stock when it comes down on Daily or Weekly.
DayTrader:
Entry : When 30 Mins Chart Shows - 3 Cross Over 7 - Target is Exit at 60 Mins 3 EMA and SL is Close below Lowest 7 EMA on 15 or 10 or 5.
Remember: Price can go to any extent, the Close is KEY.
Operator to shake out weal hands, will take the price down in a uptrend.
Entry : When 30 Mins Chart Shows - 3 Cross Over 7 - Target is Exit at 60 Mins 3 EMA and SL is Close below Lowest 7 EMA on 15 or 10 or 5.
Remember: Price can go to any extent, the Close is KEY.
Operator to shake out weal hands, will take the price down in a uptrend.
The Low which the Operator will take would be at best 9 EMA on the Lower Time Frame charts and then give a close above the 3 EMA on 30 Mins chart.
Same applies in a downtrend but in reverse fashion.
High would be 3 / 7 EMA of the Highest time frame and Sell off will come.
Same applies in a downtrend but in reverse fashion.
High would be 3 / 7 EMA of the Highest time frame and Sell off will come.
Rules of Using EMA:
To construct a moving average ribbon, simply plot a large number of moving averages of varying time period lengths on a price chart at the same time. Eg: 3, 7, 9, 20 and 50.
To construct a moving average ribbon, simply plot a large number of moving averages of varying time period lengths on a price chart at the same time. Eg: 3, 7, 9, 20 and 50.
DownTrend Identification:
When the ribbon folds – all of the moving averages converge into one close point on the chart – trend strength is likely weakening and possibly pointing to a reversal.
When the ribbon folds – all of the moving averages converge into one close point on the chart – trend strength is likely weakening and possibly pointing to a reversal.
UpTrend Identification:
The opposite is true if the moving averages are fanning and moving apart from each other, suggesting that prices are ranging and that a trend is strong or strengthening.
The opposite is true if the moving averages are fanning and moving apart from each other, suggesting that prices are ranging and that a trend is strong or strengthening.
Downtrends are highlighted by shorter moving averages crossing below longer moving averages. Uptrends, conversely, show shorter moving averages crossing above longer moving averages.
In these circumstances, the short-term moving averages act as leading indicators that are confirmed as longer-term averages trend towards them.
The number and type of moving averages vary considerably between traders, based on investment strategies and the underlying security or index. But EMAs are especially popular, because they give more weight to recent prices, lagging less than other averages.
Key Points: In an Uptrend After a Fall- The 3 EMA Cross Over 7 Has to happen on all Time Frames - Starting from One Minute, 3 , 5, 15, 30, 60, 4 Hours, 1 Days, 1 Week and 1 Month.
For a DownTrend to Confirm that its a Long Term Bearish Market 3 Cross Down Has to happen on All.
For a DownTrend to Confirm that its a Long Term Bearish Market 3 Cross Down Has to happen on All.
To put it in a LayMans Language: If a Human Has to Undress to Take bath then He first has to take off the Upper Clothes and Last is the Inner Clothes and Post Bath to get ready First has to wear the Inner Clothes and then Upper Clothes.
One Doesn’t wear an Underwear on Pants
One Doesn’t wear an Underwear on Pants
StopLoss: Remember Stop Loss is Like your Insurance Cover.
Retail being Short Term Traders, advise to use 9 or 20 EMA as SL for all your Trades.
Entry is 3 Cross Over 7.
Exit is Next Time Frames 3 EMA.
Retail being Short Term Traders, advise to use 9 or 20 EMA as SL for all your Trades.
Entry is 3 Cross Over 7.
Exit is Next Time Frames 3 EMA.
StopLoss: What type of SL to use depends on your ability to fund the MTM or the Position Size.
Few use Touch and Go SL. Few Use Closing Basis Stop Loss.
Remember Price can go to any extent, the CLOSE is Key. Hence take a call on SL basis your Profile and Bank Account Size.
Few use Touch and Go SL. Few Use Closing Basis Stop Loss.
Remember Price can go to any extent, the CLOSE is Key. Hence take a call on SL basis your Profile and Bank Account Size.
Key Advises:
1. Screen as many charts as you can.
2. Look at all the time frames and record the price.
3. Monitor on a daily Chart where Support comes and Where Resistance comes for Stocks which are in Uptrend and Stocks which are in DownTrend.
4. Keep a record of all stocks.
1. Screen as many charts as you can.
2. Look at all the time frames and record the price.
3. Monitor on a daily Chart where Support comes and Where Resistance comes for Stocks which are in Uptrend and Stocks which are in DownTrend.
4. Keep a record of all stocks.
5. Monitor them over a period of 1 month.
6. Carry paper trades basis your understanding and record if you got it right or wrong.
7. Position size should always be fixed.
8. Follow a standard position size if you are Index Trader.
9. Do not apply this in OPTIONS.
10. Good Luck.
6. Carry paper trades basis your understanding and record if you got it right or wrong.
7. Position size should always be fixed.
8. Follow a standard position size if you are Index Trader.
9. Do not apply this in OPTIONS.
10. Good Luck.
Here we end Chapter 2 on EMA.
Will Open a New Tweet for Comments.
Never Trade Against the Trend - As you will never know where the Buyer / Seller will come and take you for a ride.
Be with the Force Always !!!
Will Open a New Tweet for Comments.
Never Trade Against the Trend - As you will never know where the Buyer / Seller will come and take you for a ride.
Be with the Force Always !!!
There is some thing which I intentionally didn't explain. Will see how many come up with that as a query. Some thing really important.
#Glossary:
EMA - Exponential Moving Average
DEMA - 1 Day EMA
WEMA - 1 Week EMA
MEMA - 1 Month EMA
HEMA - 1 Hour EMA
No Names for 1, 3, 5 10, 15, 30 Minutes EMA.
EMA - Exponential Moving Average
DEMA - 1 Day EMA
WEMA - 1 Week EMA
MEMA - 1 Month EMA
HEMA - 1 Hour EMA
No Names for 1, 3, 5 10, 15, 30 Minutes EMA.
• • •
Missing some Tweet in this thread? You can try to
force a refresh


