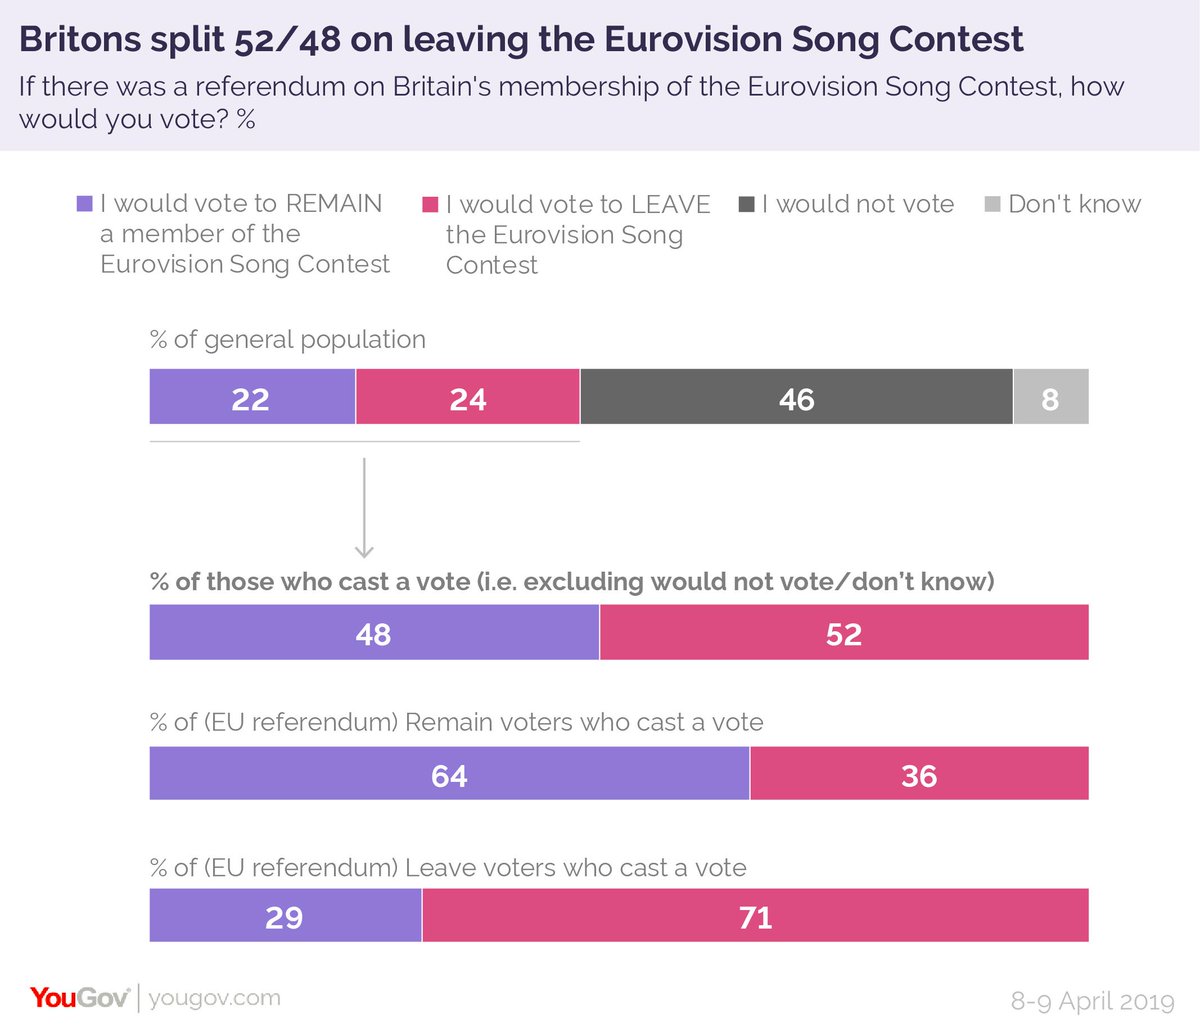
Brits would vote to leave the #Eurovision Song Contest... by 52% to 48%. Leave voters are much more likely to want to pull us out than Remain voters yougov.co.uk/topics/politic…
Britons are noticeably more likely than other Europeans to thing that people vote in #Eurovision for political reasons. In fact, 31% think that's the only basis on which people vote, compared to 4-15% elsewhere yougov.co.uk/topics/politic…
23% of Brits intend to watch this year's #Eurovision, but we tend to have less 'nice' motivations for doing so. Our most common reasons for watching are because of the (famously sarcastic) commentary (25%) and to make fun of it (19%) yougov.co.uk/topics/politic…
• • •
Missing some Tweet in this thread? You can try to
force a refresh
25 years after devolution for Scotland, and 10 years after the independence referendum, what constitutional set-up do Scots support having?
Devolution, more powers: 51% support
Devolution, current powers: 46%
Autonomy within UK: 42%
Full independence: 41%
Abolition of devolution: 21%
Devolution, fewer powers: 19%
In Wales, existing or enhanced devolution are also the most popular options, though 31% would support abolishing devolution
Devolution, more powers: 40% support
Devolution, current powers: 39%
Autonomy within UK: 32%
Abolition of devolution: 31%
Full independence: 24%
Devolution, fewer powers: 23%
With the 10 year anniversary of the Scottish independence referendum tomorrow, support for 'Yes' and 'No' among voters stands at effectively the same level as a decade ago
'Yes' voters are more likely to have changed their minds since 2014, but are being replenished by younger voters who lean towards Scottish independence
Two-thirds of Conservative members want to be able to vote on policy at conference and be able to vote on all leadership candidates, with six in ten also wanting to elect a deputy leader
While Britons generally think the police have handled the riots well, they lack confidence in their ability to protect people and property from further unrest
A lot/some confidence: 38%
Not a lot/no confidence: 58%
When asked to rank parties in order of preference, Labour are still Britons’ overall favourite party, but the Lib Dems ultimately have broader popularity – being more people’s second or third favourite party.
Ranked first
Labour 28%
Conservatives 21%
Reform UK 18%
Greens 17%
Lib Dems 13%
Ranked first, second or third
Lib Dems 79%
Labour 70%
Greens 60%
Conservatives 43%
Reform UK 41%
Overall, fewer than one in five Britons are consistently right-wing in their party preferences, i.e. rank the Conservatives and Reform UK ahead of every other party, compared to 40% who rank all major progressive parties ahead of them.
Having asked the public to rank the main parties, how often does a given party get ranked higher than other parties? Labour are always preferred by more people in every combination, while Reform UK are always the less-preferred party in their 'head-to-heads'.
Labour 65% vs Reform UK 35%
Labour 61% vs Conservatives 39%
Labour 58% vs Greens 42%
Labour 52% vs Lib Dems 48%
Lib Dems 65% vs Reform UK 35%
Lib Dems 63% vs Greens 37%
Lib Dems 62% vs Conservatives 38%
Greens 59% vs Reform UK 41%
Greens 57% vs Conservatives 43%