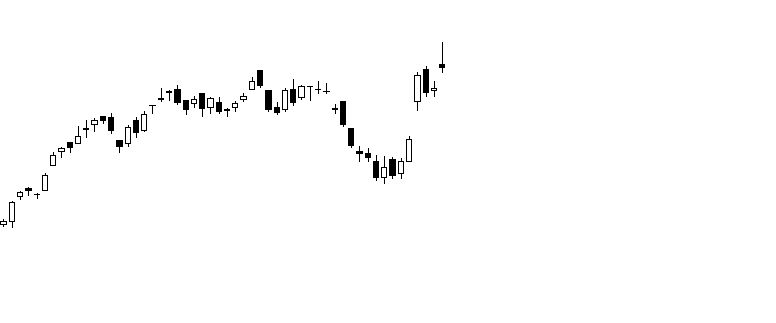
#Nifty 2014 and #Nifty 2019. Similar Candle in the making? Next is to watch out for broader indices if they can show follow up in coming days. #Smallcap 2014 started following up next day.
Multi-Year Range Breakouts in Nifty50 Stocks but Nifty50 Making Lower Tops –What to Do ?
Apart from that
1) Global Indices – US and Europe near all time highs but India continues to struggle and making lower tops.
2) Stocks in Same Sector – One at all time high the other one at 30% drawdown.
3) What to trust the Breakout Moves or Breakdown Moves ?
This creates a dilemma for a Trader – To trust the Breakout/Breakdown or Not ?
Now lets c the Charts
The Struggling Nifty50
Positive divergences on new lows.
Still in lower tops.
Last major swing highs at 24200.
Swing lows at 22800.
Every big positive candle does not see any follow up action over next 1-3 sessions. Wait for this to change.
#Retail Inflows continue to be strong but Sebi categorization of Stocks > 33k cr Mkt cap being considered Midcap has led to over-ownership and overvaluation in the Top Midcap & Smallcap ( > 20k cr )
Data from Monarch AIF Note.
1) Price CAGR >> Earnings CAGR
Nifty50 and Nifty500 have moved inline with earnings cagr.
NiftyMidcap 100 has seen max re-rating. A price cagr of 27.3% against 11.7% earnings.
2) Concentrated Flows
Mid + Small + Thematic = 55-60% share of MF pure equity net inflows in CY23 and CY24