
#Data2Information: A Tale of #OpsDashboard Development
A tweet series about being presented with a need and a dataset and then turning that data into information in the form of a dynamic dashboard using @ArcGISOnline (with my added thoughts).
A tweet series about being presented with a need and a dataset and then turning that data into information in the form of a dynamic dashboard using @ArcGISOnline (with my added thoughts).
I have been configuring quite a few #OpsDashboards - @ArcGISApps lately so I thought I would chronicle my most recent experience as I assume others find themselves facing the same challenges/opportunities (or I atleast hope I'm not the only one).
I received a forwarded email saying "Any ideas on something cool?" FYI - this is the type of email I love to get because it's basically an ask with free reign of creativity (while being budget conscience of course).
I scrolled down to see a general description of the ask - a public map that shows a stretch of road in Louisiana that will need to be included in a pavement rehab design report currently being drafted. (Sweet! Pavement, everybody likes pavement!)
Attached is a "prettified" spreadsheet of boring locations. (I say "prettified" because the spreadsheet has formatting and other stuff going on, but I see that two of those fields are Lat/Long so we're good #check)
So do I make a @John_M_Nelson (Bob Ross) cartographic masterpiece? 3D? Web AppBuilder? #StoryMap? #OpsDashboard? #TBD
I could put together an #OpsDashboard that allows the audience the ability to explore the data for themselves while also providing a quick over of key metrics at first glance.
A screenshot of the #OpsDashboard can be included in the paper report. (The whole thing could probably be made into a #storymap to be completely immersive, but I digress...For now a link and a screenshot of the dashboard will do.) #ButFirst I need to get the data right.
I need the "prettified" spreadsheet as a clean table - just columns and rows. I need to strip all of the spacing and some of the extra calculations that are included like sum and avg. (I have no idea what most of these fields mean #metadata)
Whatever the solution ends up being I make will be able to do that on the fly - generate a report, write some #arcade expressions in a pop up of a web map, make an #OpsDashboard... lots of possibilities.
Alright, the data is good. Now lets load this spreadsheet as an item in @ArcGISOnline and publish the file as a hosted layer. (Somewhat worried I switched the Lat/Long fields - Lat is Flat - Ok, we are good. The points aren't reversed and somewhere in China.)
Open in Map Viewer -> The points align on the road where the boring locations happen. Configure the pop-up to be as simple and clean as possible. (Still have no idea what these fields are #metadata)
Share -> Create a Web App -> Configurable Apps: No (useful, but too easy, maybe a #storymap later), Web AppBuilder: No (also useful, but not this time), Operations Dashboard: Yes (Ok, #LetsGo)
(Wait, what organization is this product for? I need to match the branding of the map and #OpsDashboard with the brand of the org) I look up the colors of the organization and get the Hex color codes of the dark blue, light blue and orange to incorporate to my overall design.
(Y'all still with me?!) #Data2Information #GIS
#SpoilerAlert - The final #OpsDashboard is powered by just two spreadsheets. The first spreadsheet with 8 records x 7 fields and the second spreadsheet with 15 records x 18 fields. (Not a massive dataset, but plenty to work with.) 

A new dashboard represents so much oppurtunity to present data in different ways. Not knowing exactly what these fields mean (#metadata), I start to analyze which fields are text vs integer and how to best present the data.
Which fields would be best represented by a pie chart? Bar chart? Line graph? Does it need to be a smoothed line? How do I want the elements to relate to each other when selected?
What indicators do I want to specifically show? (The data that was sent to me has sums and averages shown so that sounds good to me as a start.)
First draft done and delivered (wonder if they'll like it). Feedback incoming...Incorporate changes. Repeat 2 more times (lots of emails).
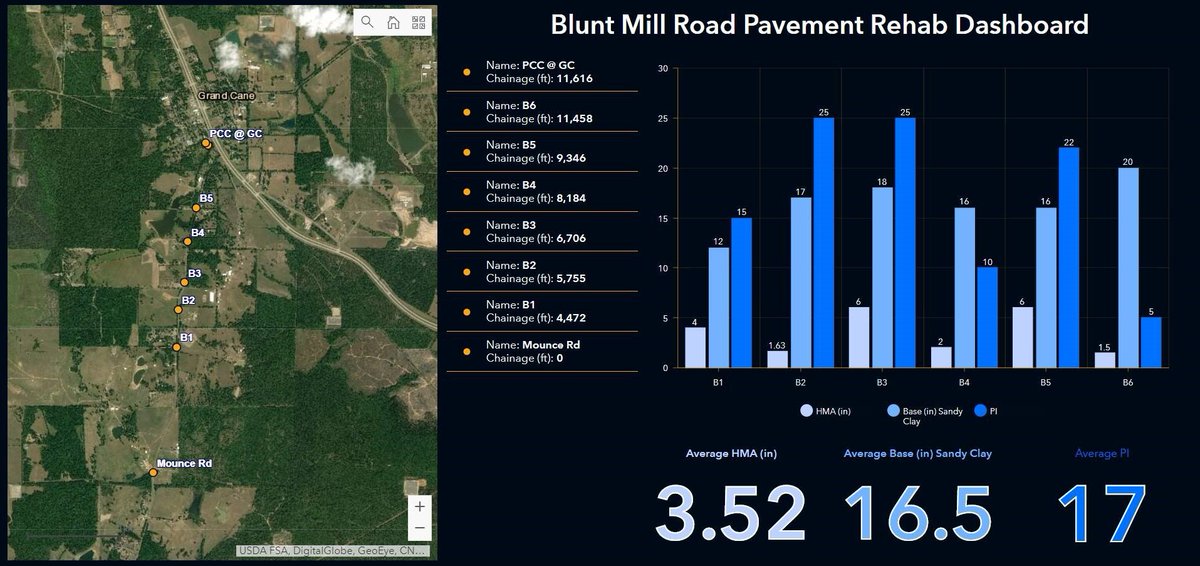
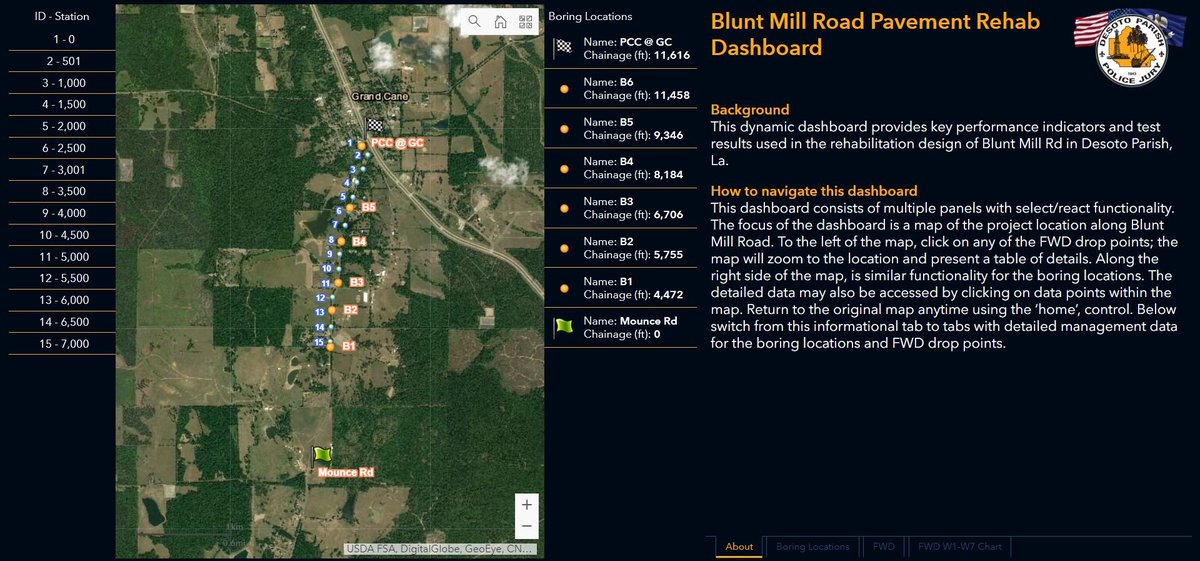
Final Product: Blunt Mill Road Pavement Rehab Dashboard
arcg.is/1DX8W1
Still have no idea what most of the data means (#metadata), but client is happy and the metadata will be covered in detail in the report. The dashboard isn't the place. (I can understand that.)
arcg.is/1DX8W1
Still have no idea what most of the data means (#metadata), but client is happy and the metadata will be covered in detail in the report. The dashboard isn't the place. (I can understand that.)
#Data2Information Takeaways
1 - Get the data right and publish as a data service.
2 - Get the web map right considering pop-ups, labels, layer order, refresh rate.
3 - Include the branding scheme of the intended audience.
1 - Get the data right and publish as a data service.
2 - Get the web map right considering pop-ups, labels, layer order, refresh rate.
3 - Include the branding scheme of the intended audience.
#Data2Information Takeaways continued
4 - KISS (Keep it simple stupid) - If you are having trouble fitting elements of an #OpsDashboard, then it's probably too much. Group and Stack.
5 - Include an About panel to explain the #OpsDashboard much like a splash screen.
4 - KISS (Keep it simple stupid) - If you are having trouble fitting elements of an #OpsDashboard, then it's probably too much. Group and Stack.
5 - Include an About panel to explain the #OpsDashboard much like a splash screen.
#Data2Information Takeaways continued
6 - Much like developing the elements of a dashboard efficiently, composing a series of tweets requires lots of planning. #280characters
Thanks for following! #gischat
6 - Much like developing the elements of a dashboard efficiently, composing a series of tweets requires lots of planning. #280characters
Thanks for following! #gischat
• • •
Missing some Tweet in this thread? You can try to
force a refresh


