Wormhole Profile picture
Oct 10, 2019 7 tweets 2 min read Read on X
Starting a thread to explain the new DOM Price Ladder Chart in GoCharting- the best on the web Image
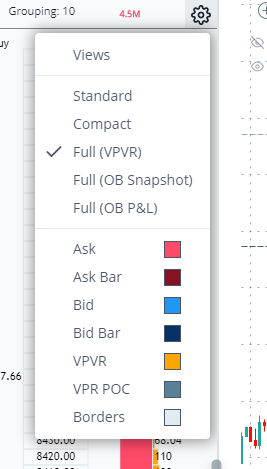
1. The Chart comes with five built-in views Image
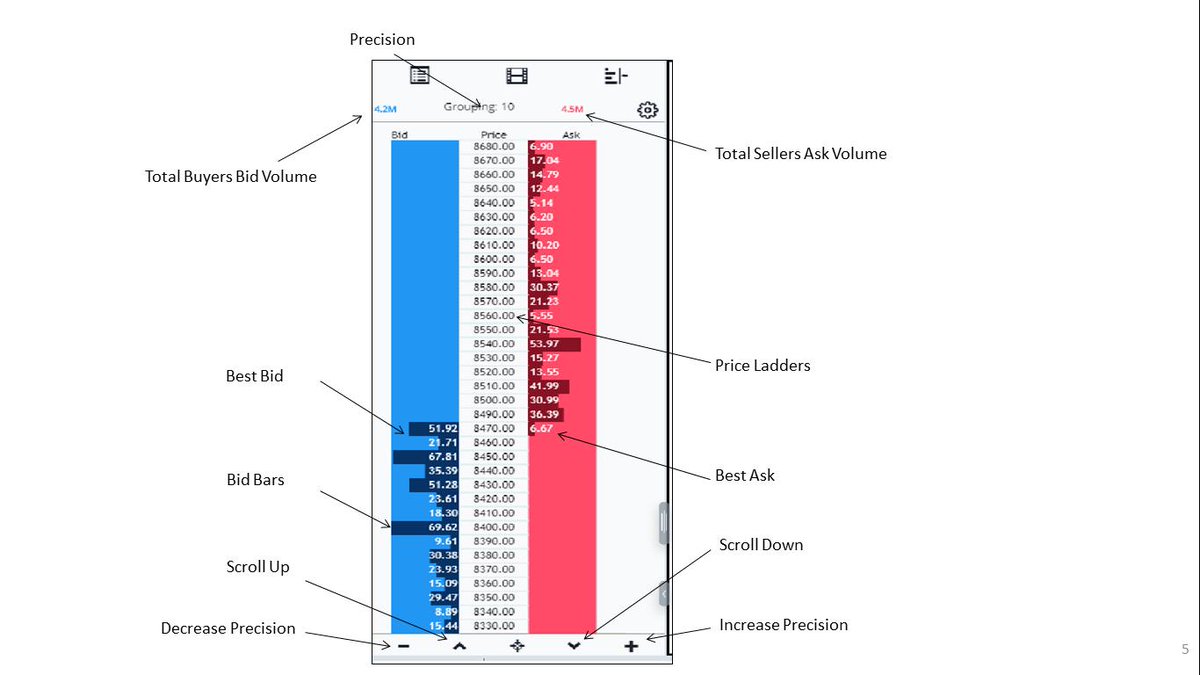
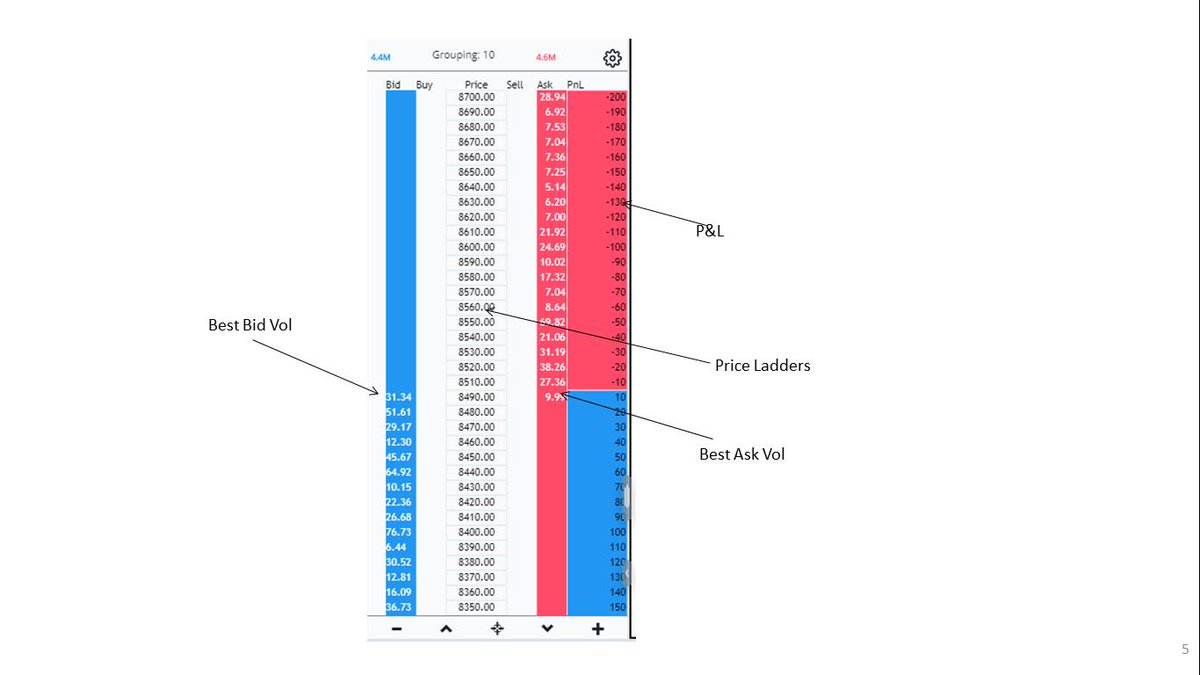
2. The Standard View is what we all are familiar with - comprising of the Bids and Asks on a Ladder Image
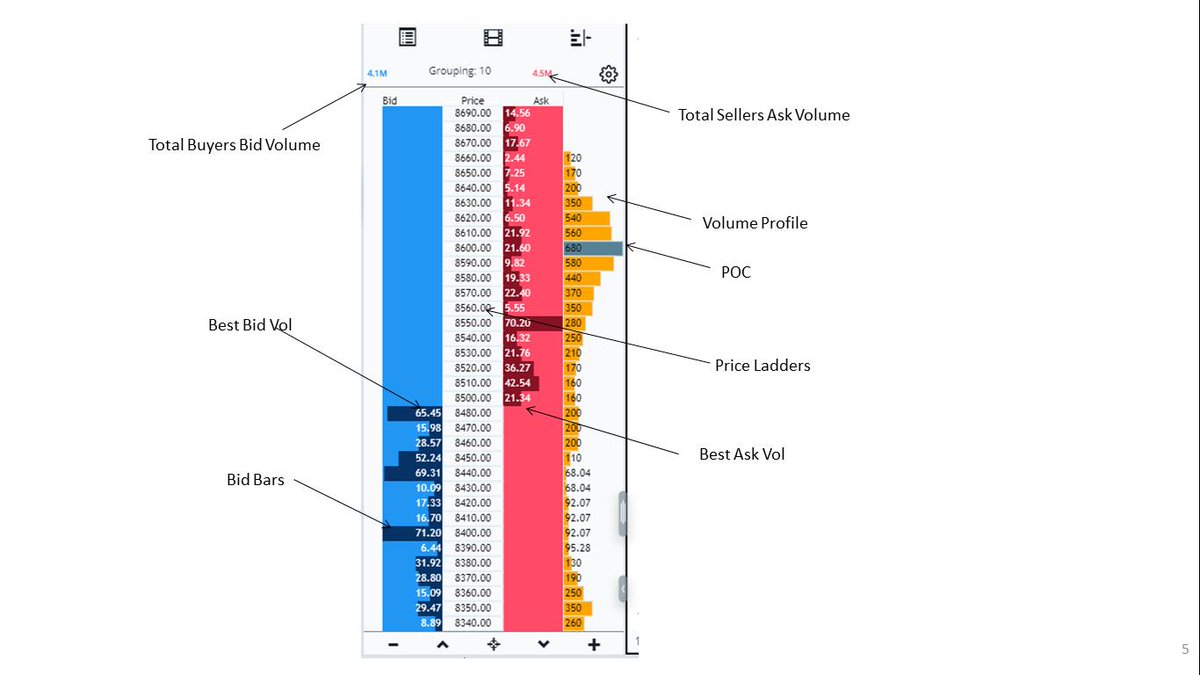
3. Next is the Compact View

Compact View = Standard View + Volume Profile Image
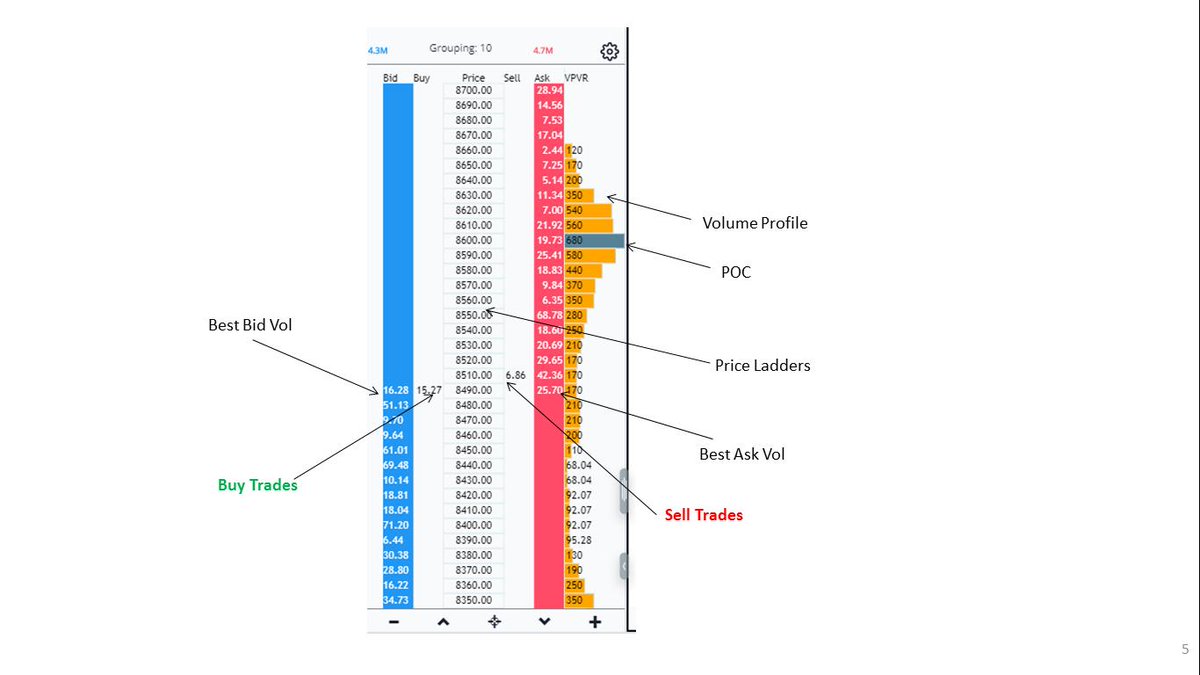
4. The Third View is the Full VPVR view.

Full (VPVR) View = Orderbook + Time and Sales Image
5. The next view is called the OB Snapshot view

OB Snapshot view replaces the volume profile with a cumulative counter of all bids and asks in the orderbook since the start of the session Image
The final view is the OB P&L view.

OB P&L view simply replaces the Volume Profile with a P&L Image

• • •

Missing some Tweet in this thread? You can try to force a refresh
 

Keep Current with Wormhole

Wormhole Profile picture

Stay in touch and get notified when new unrolls are available from this author!

Read all threads

This Thread may be Removed Anytime!

PDF

Twitter may remove this content at anytime! Save it as PDF for later use!

Try unrolling a thread yourself!

how to unroll video
  1. Follow @ThreadReaderApp to mention us!

  2. From a Twitter thread mention us with a keyword "unroll"
@threadreaderapp unroll

Practice here first or read more on our help page!

More from @gocharting

Nov 10, 2022
1/n

Let's start with the definition of COT High/Low and how it is used in Daytrading with Orderflow

COT is the abbreviation for Commitment Of Traders. There are two COTs:
COT High
COT Low

🧵 #daytading #gocharting #orderflow
2/n

COT High is cumulative bid/ask Delta starting from the moment when the price makes new high or repeats previous one.

COT Low is cumulative bid/ask Delta starting from the moment when the price makes new low or repeats previous one.
COT helps to see buy/sell balance after new price level has been reached. In other words, it helps us identify TRAPPED buyers and sellers in the market
Read 6 tweets
Oct 1, 2020
[1/X] Attempt to explain Imbalance Chart to a 10 year old
You want into an air conditioner (AC) in the peak summers.. the shopkeeper tells you that the price of the AC is 35 k, which you think is expensive.. this price of 35k which the shopkeeper quoted is Ask Price
[2/X] Since you feel the ask/offer price by the shopkeeper is high, you tell him that you can pay 30 k for the AC.. this price quoted by you is the Bid Price

Now one of you (shopkeeper or you) has to accommodate for the sale of the AC. This is an Auction
[3/X] Since it is peak summer and the demand is high, the shopkeeper isn't budging..so you go ahead and buy the ac at his offer/ask price.. this is called Lifting the Offer
Read 14 tweets
Sep 29, 2020
[1/X] Introducing Imbalance Charts in GoCharting

Imbalance is a special variation of the Footprint chart that highlights aggressive buying and selling (some market participants manifested aggressive behavior)
[2/X] Imbalance compares bids and asks diagonally and shows a significant excess of one over the other. That is, a bid is compared with an ask, which is one level higher, and an ask is compared with a bid, which is one level lower.
[3/X] The bar in the picture above shows how aggressive sellers entered the market and pushed the price at each price level. Such an aggression, as a rule, results in price reduction.

The yellow highligted cells reflect such aggressive behaviour on the buy and sell sides
Read 4 tweets
Sep 25, 2020
[1/X]

Basics of Auction and Profile Distribution - terms like Market Profile and Volume Profile simplified

What is Profile Distribution?

Distribution is the process of trading activity that takes place in the market auction. Some also know it by a consolidation or range.
[2/X]

A Distribution tends to define the fairest area/ price where the current auction has been taking place.
However, during some trading sessions, after the market forms a distribution around a certain fair price/ value, something changes.....
[3/X]

It could be anything - some big money stepping in deeming the price to be auctioning below value, news, event ,etc.. we don't know that and it doesn't matter.. what we are interested in is what happens after....
Read 7 tweets
Sep 25, 2020
We have now released an important Orderflow Indicator called the Bar Statistics

A Bar Statistics provides a tabular view of the important Orderflow metrics at a candle level in a time series format while each of the footprint provides a cohort view of the similiar metrics Image
To activate this particular indicator, please choose Bar Statistics from Inidcators menu on the top bar under Orderflow section

#Orderflow #Footprint #Cluster #NSE Image
The Bar Statistics indicator in GoCharting is fully loaded with 21 Orderflow metrics to choose from (no kidding!!!)

Will try our best to explain each one of them. We may go crazy in the future and add more to this list Image
Read 4 tweets
Sep 24, 2020
The next version of the Orderflow Module is now released on Beta

More Indicators

More Options

More Customizations

More Analytics....

Follow this thread along..... on the updates
First Important Change - Now you can manually set the size of the cluster boxes using the Tick Multiplier Parameter under Settings Tab.

What it means?

Now Cluster Boxsize = TickSize X Multiplier

If Nifty Tick = 0.5 INR and Multilplier = 3

Boxsize = 0.5 X 3 = 1.5 INR Image
[3/X] The default view is on AUTO tick multiplier mode. This means that an algorithm will decide the cluster box size using a tick multplier computed on the basis of your screen dimensions to make the underlying figures visible and readable

See the difference between below ImageImage
Read 7 tweets

Did Thread Reader help you today?

Support us! We are indie developers!


This site is made by just two indie developers on a laptop doing marketing, support and development! Read more about the story.

Become a Premium Member ($3/month or $30/year) and get exclusive features!

Become Premium

Don't want to be a Premium member but still want to support us?

Make a small donation by buying us coffee ($5) or help with server cost ($10)

Donate via Paypal

Or Donate anonymously using crypto!

Ethereum

0xfe58350B80634f60Fa6Dc149a72b4DFbc17D341E copy

Bitcoin

3ATGMxNzCUFzxpMCHL5sWSt4DVtS8UqXpi copy

Thank you for your support!

Follow Us!

:(