Wormhole Profile picture
World's first multi-asset Orderflow charting and trading platform on the web App: https://t.co/gWXMVjdmX2 Official Telegram: https://t.co/rlID56p7lo
Prasanth Reddy Profile picture A.S. SAXENA Profile picture Rajamani Gounder Profile picture 3 subscribed
Nov 10, 2022 6 tweets 1 min read
1/n

Let's start with the definition of COT High/Low and how it is used in Daytrading with Orderflow

COT is the abbreviation for Commitment Of Traders. There are two COTs:
COT High
COT Low

🧵 #daytading #gocharting #orderflow 2/n

COT High is cumulative bid/ask Delta starting from the moment when the price makes new high or repeats previous one.

COT Low is cumulative bid/ask Delta starting from the moment when the price makes new low or repeats previous one.
Oct 1, 2020 14 tweets 3 min read
[1/X] Attempt to explain Imbalance Chart to a 10 year old
You want into an air conditioner (AC) in the peak summers.. the shopkeeper tells you that the price of the AC is 35 k, which you think is expensive.. this price of 35k which the shopkeeper quoted is Ask Price [2/X] Since you feel the ask/offer price by the shopkeeper is high, you tell him that you can pay 30 k for the AC.. this price quoted by you is the Bid Price

Now one of you (shopkeeper or you) has to accommodate for the sale of the AC. This is an Auction
Sep 29, 2020 4 tweets 2 min read
[1/X] Introducing Imbalance Charts in GoCharting

Imbalance is a special variation of the Footprint chart that highlights aggressive buying and selling (some market participants manifested aggressive behavior) 
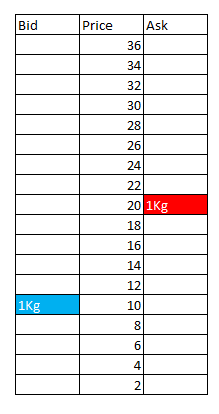
[2/X] Imbalance compares bids and asks diagonally and shows a significant excess of one over the other. That is, a bid is compared with an ask, which is one level higher, and an ask is compared with a bid, which is one level lower.
Sep 25, 2020 7 tweets 2 min read
[1/X]

Basics of Auction and Profile Distribution - terms like Market Profile and Volume Profile simplified

What is Profile Distribution?

Distribution is the process of trading activity that takes place in the market auction. Some also know it by a consolidation or range. [2/X]

A Distribution tends to define the fairest area/ price where the current auction has been taking place.
However, during some trading sessions, after the market forms a distribution around a certain fair price/ value, something changes.....
Sep 25, 2020 4 tweets 3 min read
We have now released an important Orderflow Indicator called the Bar Statistics

A Bar Statistics provides a tabular view of the important Orderflow metrics at a candle level in a time series format while each of the footprint provides a cohort view of the similiar metrics Image To activate this particular indicator, please choose Bar Statistics from Inidcators menu on the top bar under Orderflow section

#Orderflow #Footprint #Cluster #NSE Image
Sep 24, 2020 7 tweets 3 min read
The next version of the Orderflow Module is now released on Beta

More Indicators

More Options

More Customizations

More Analytics....

Follow this thread along..... on the updates First Important Change - Now you can manually set the size of the cluster boxes using the Tick Multiplier Parameter under Settings Tab.

What it means?

Now Cluster Boxsize = TickSize X Multiplier

If Nifty Tick = 0.5 INR and Multilplier = 3

Boxsize = 0.5 X 3 = 1.5 INR Image
Sep 22, 2020 18 tweets 6 min read
[1/X] Attempt to explain Orderflow basics. It will be a long thread but will try to make the content worth the read.

Below is a Depth of Market (DOM). The
Blue ones = Bid Limit orders
Red ones = Ask Limit orders

So what happens to these orders in the trade cycle

#Basics Image [2/X] Such limit orders are invariable absorbed by the Market Orders.

It is the Market Orders that drive the markets up and down.

Lesson # 1: Every auction starts with a Bid and an Ask
Lesson # 2: Market orders move the price
Aug 23, 2020 9 tweets 3 min read
The Rabbit Hole is Deep. 🐇

Screenshots from some massive improvements to Market and Volume Profile coming up very soon

1. Customizations on steoirds
2. Auto Pattern Recognition - Poor High / Poor Low etc.

Will start a thread...

#MarketProfile #VolumeProfile ImageImageImage 1. Auto Recognition of Patterns

What is Poor High/Poor Low?

Poor low and Poor High are market profile structure which generally indicates a market that is too long or too short and the shorter timeframe players in the market has low confidence about the current market direction
Aug 8, 2020 4 tweets 3 min read
Point and Figure Charts now come with built-in Bullish and Bearish pattern recognition

🚀Double Top
🚀Double Bottom
🚀Triple Top
🚀Triple Bottom
🚀High Pole
🚀Low Pole
🚀Significant Column

Go to Appearance tab and activate the patterns

#pnf #patterns #charting #pointfigure Bullish Double Top and Bottom
Jul 24, 2020 5 tweets 3 min read
Indicator on Indicator (beta) -

Another premium feature in other popular platforms is now available for FREE in GoCharting.

Please follow the steps in this thread

#premium #indicators #charting #advanced Image 
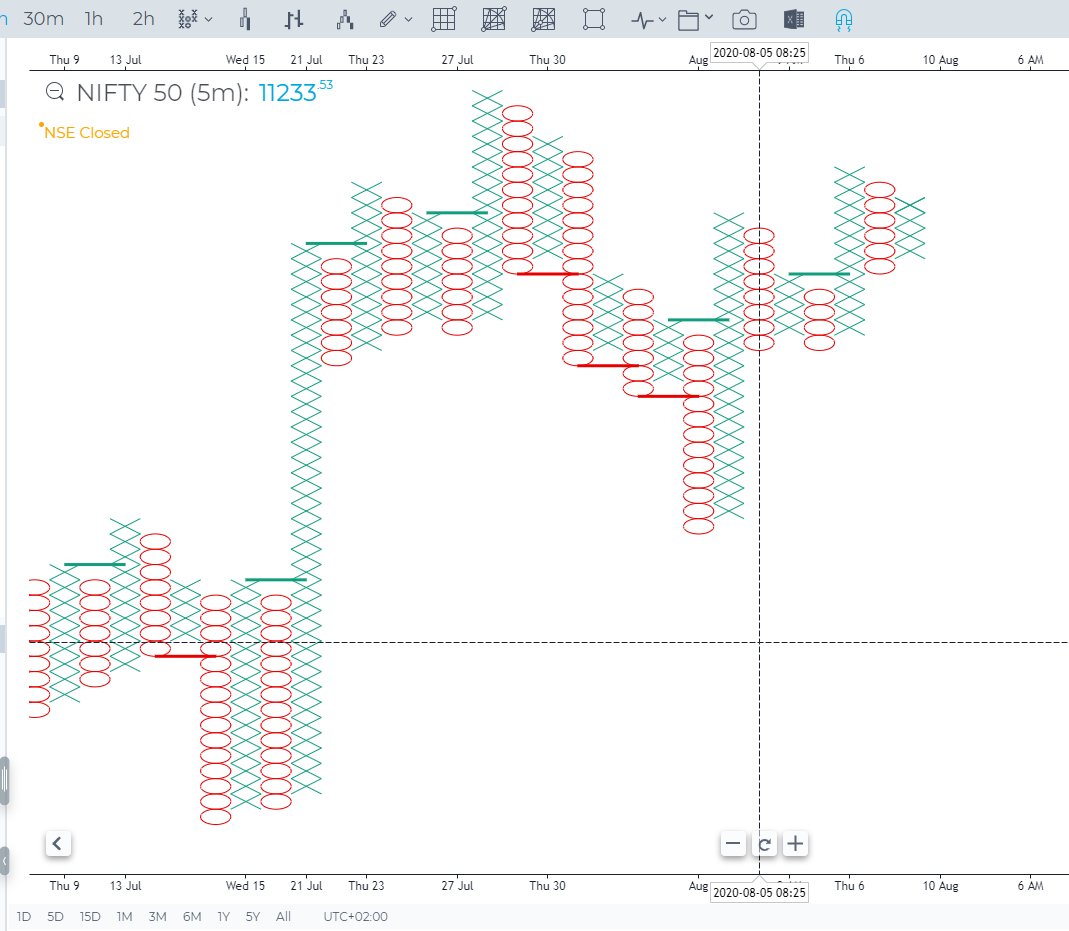
Click on the Indicator series legend and select "Add Indicator" option Image
Jun 1, 2020 4 tweets 2 min read
Happy to announce partnership with Binance to bring live trading off GoCharting Charts

We support both Spot and Futures trading on Binance. Its a forever FREE feature

Order Types: Limit/Market/Stop/Stop Limit.

Steps given below...

#binance #trading #charts Image 1/3

Connect to Binance: Image
Mar 15, 2020 4 tweets 2 min read
Happy to announce our partnership with @DeribitExchange to bring live trading on and futures directly through GoCharting

Volume Profile, Market Profile Charts
Renko, Range Bar Charts
one-click mouse API Trading
...

gocharting.com/terminal?ticke… Step 1: Go to the Gocharting AppStore (Right Panel) Image
Feb 9, 2020 5 tweets 3 min read
Release updates from the week ***

Update # 1

1. Every chart object name on Layers tab is now editable

2. Simple color codes to help manage your chart objects

Update # 2

Now place your Anchor VWAP on any candle of your choice directly from the chart


@ST_PYI
Nov 28, 2019 4 tweets 1 min read
Scale ratio is now available on GoCharting

We understand the importance of precision in the technical analysis and added the ability to set the exact price and time scale ratio Image 
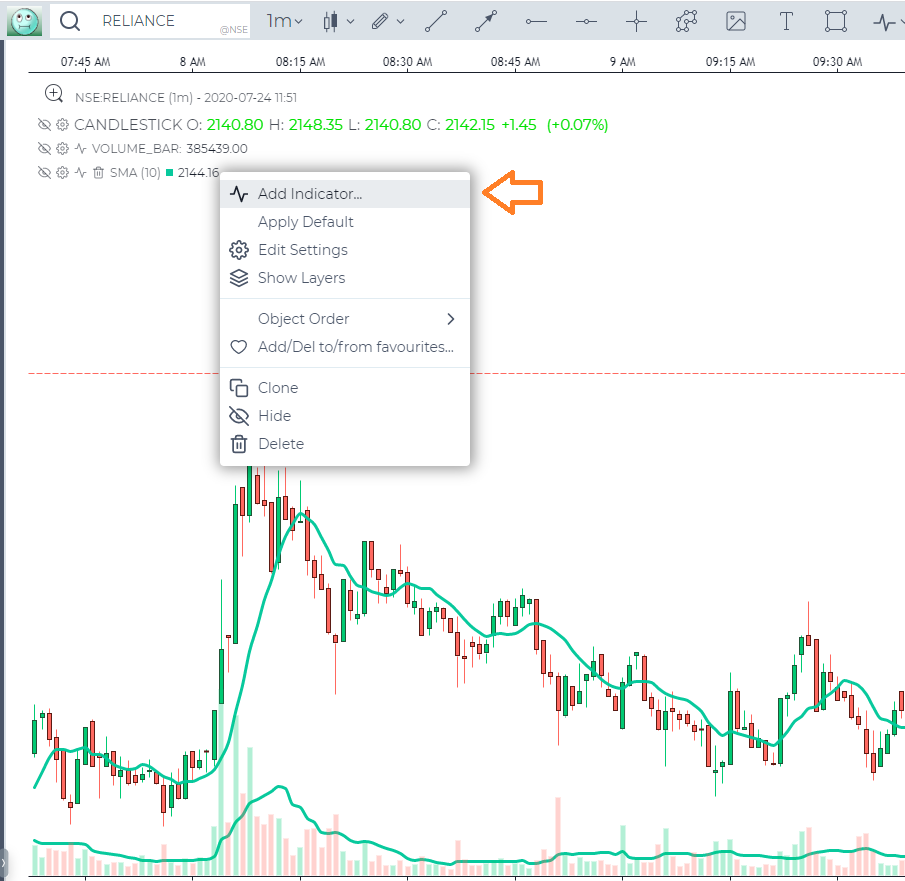
How do you set the exact scale ratio?

Go to settings tab under Axes Image
Oct 20, 2019 9 tweets 8 min read
Introducing the most advanced Renko charts on the web
1. Classic Renko
2. Median Renko
3. Geometric Renko
4. Turbo Renko
5. Advanced Renko

Starting a thread only on Renko

@SignalFi_ @flunkimoku @ColdBloodShill @SignalFi_ @flunkimoku @ColdBloodShill Classic Renko

gocharting.com/screenshots/8Z…
Oct 10, 2019 7 tweets 2 min read
Starting a thread to explain the new DOM Price Ladder Chart in GoCharting- the best on the web Image 1. The Chart comes with five built-in views Image
Oct 7, 2019 4 tweets 2 min read
Saving your charts on the cloud is officially live in GoCharting now. Starting a thread on this topic
#clouds #aws #charts #gocharting Image 
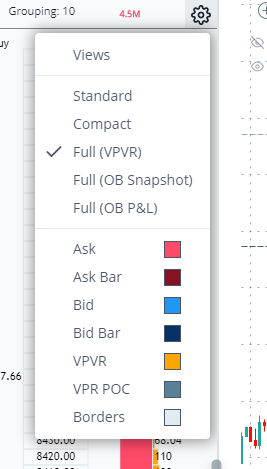
There is no cap or restrictions on the number of charts you can save on the cloud. So go nuts!!!
Aug 2, 2019 10 tweets 4 min read
On track to deploy further enhancements over the weekend based on beta user feedbacks.

#beta Bar Countdown has been added
Contributor: @syNTHETICC_ @ShowerheadATW

PS: We may later change the position of the counter in the future ImageImage
Jul 25, 2019 23 tweets 35 min read
A ton of new enhancements based on feedback received from all closed Beta users will go for a weekend deployment
#gocharting #beta #charting 🙏🙏 All enhancement have now been deployed