My Authors
Read all threads
While we’re at it, here are three blocks of #rstats code to:
1) Scrape data on number of Coronavirus cases by day
2) Do the same for cases by day for SARS in 2003
3) Plot them both and export the image
gist.github.com/johnburnmurdoc…
#covid19 #coronavirus #ggplot Image
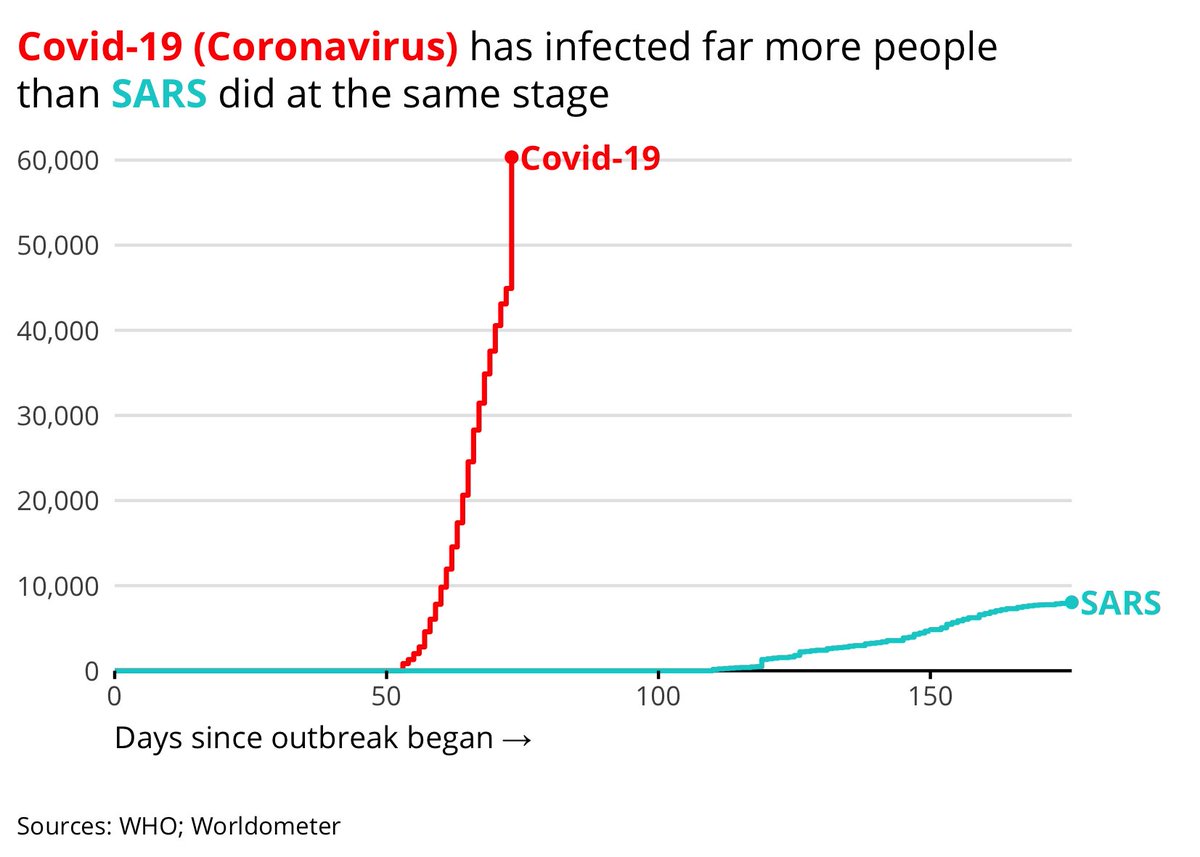
1) Scrape a table of cumulative Coronavirus cases by day Image
2) Scrape 99 horribly formatted and inconsistent pages of SARS cases from the World Health Organisation 🤓🤕🤮 Image
3) Join them and plot them (see the full script linked in my first tweet for the custom plot styles) Image
Missing some Tweet in this thread? You can try to force a refresh.

Keep Current with John Burn-Murdoch

Profile picture

Stay in touch and get notified when new unrolls are available from this author!

Read all threads

This Thread may be Removed Anytime!

Twitter may remove this content at anytime, convert it as a PDF, save and print for later use!

Try unrolling a thread yourself!

how to unroll video

1) Follow Thread Reader App on Twitter so you can easily mention us!

2) Go to a Twitter thread (series of Tweets by the same owner) and mention us with a keyword "unroll" @threadreaderapp unroll

You can practice here first or read more on our help page!

Follow Us on Twitter!

Did Thread Reader help you today?

Support us! We are indie developers!


This site is made by just two indie developers on a laptop doing marketing, support and development! Read more about the story.

Become a Premium Member ($3.00/month or $30.00/year) and get exclusive features!

Become Premium

Too expensive? Make a small donation by buying us coffee ($5) or help with server cost ($10)

Donate via Paypal Become our Patreon

Thank you for your support!