YouGov Profile picture
Mar 9, 2020 3 tweets 2 min read Read on X
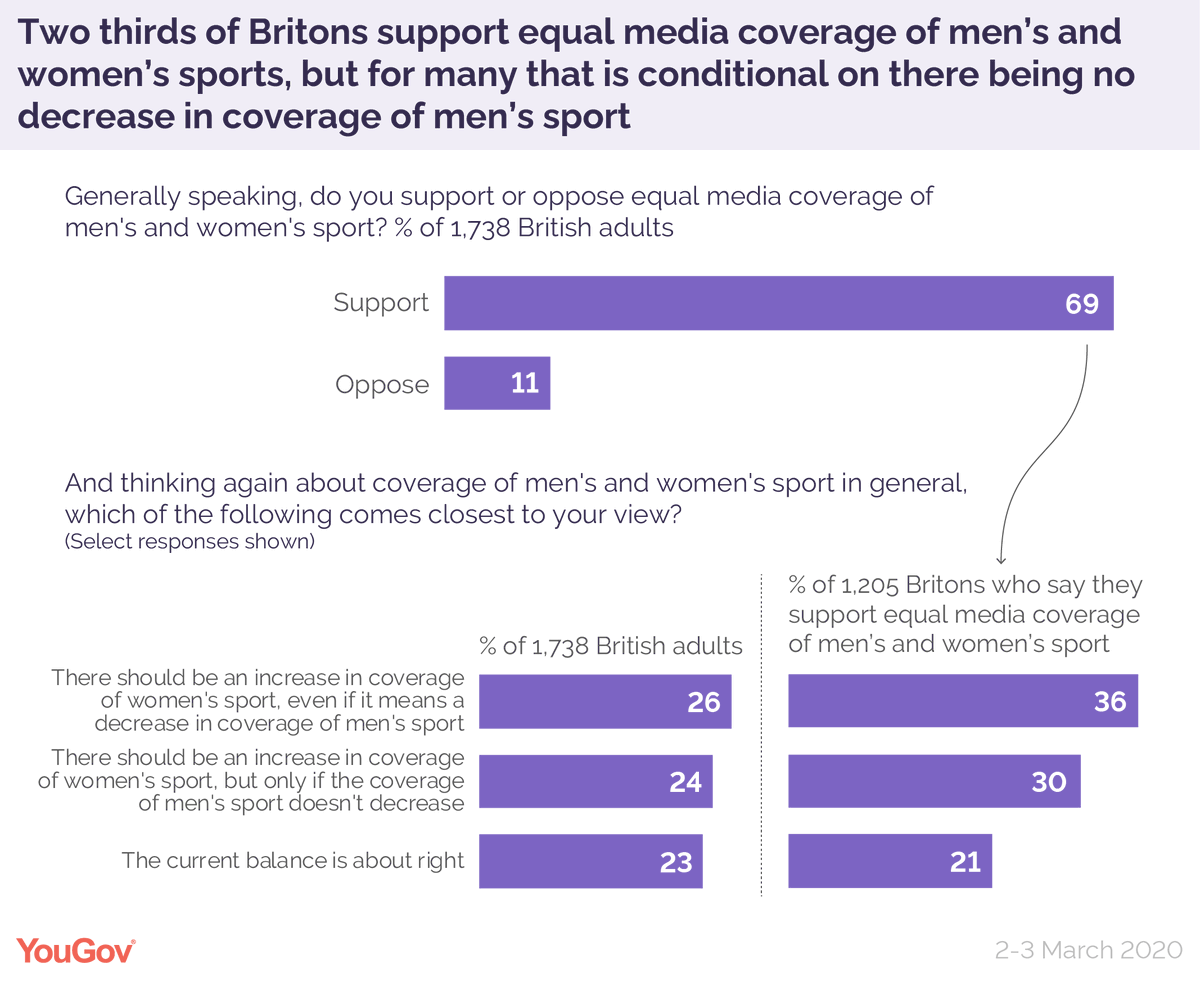
With one of the themes of #IWD2020 being equal coverage of men's and women's sports, we found that 69% of Brits support this in principle. However, in practice, only 36% of these supporters would back it if it means less coverage of the men's games yougov.co.uk/topics/sport/a… Image
It is clear that the public find women's sport increasingly appealing. On top of the 20% of Brits who have always been interested, a further 19% say they are now more interested than a few years ago - although interest is rising faster among men yougov.co.uk/topics/sport/a… Image
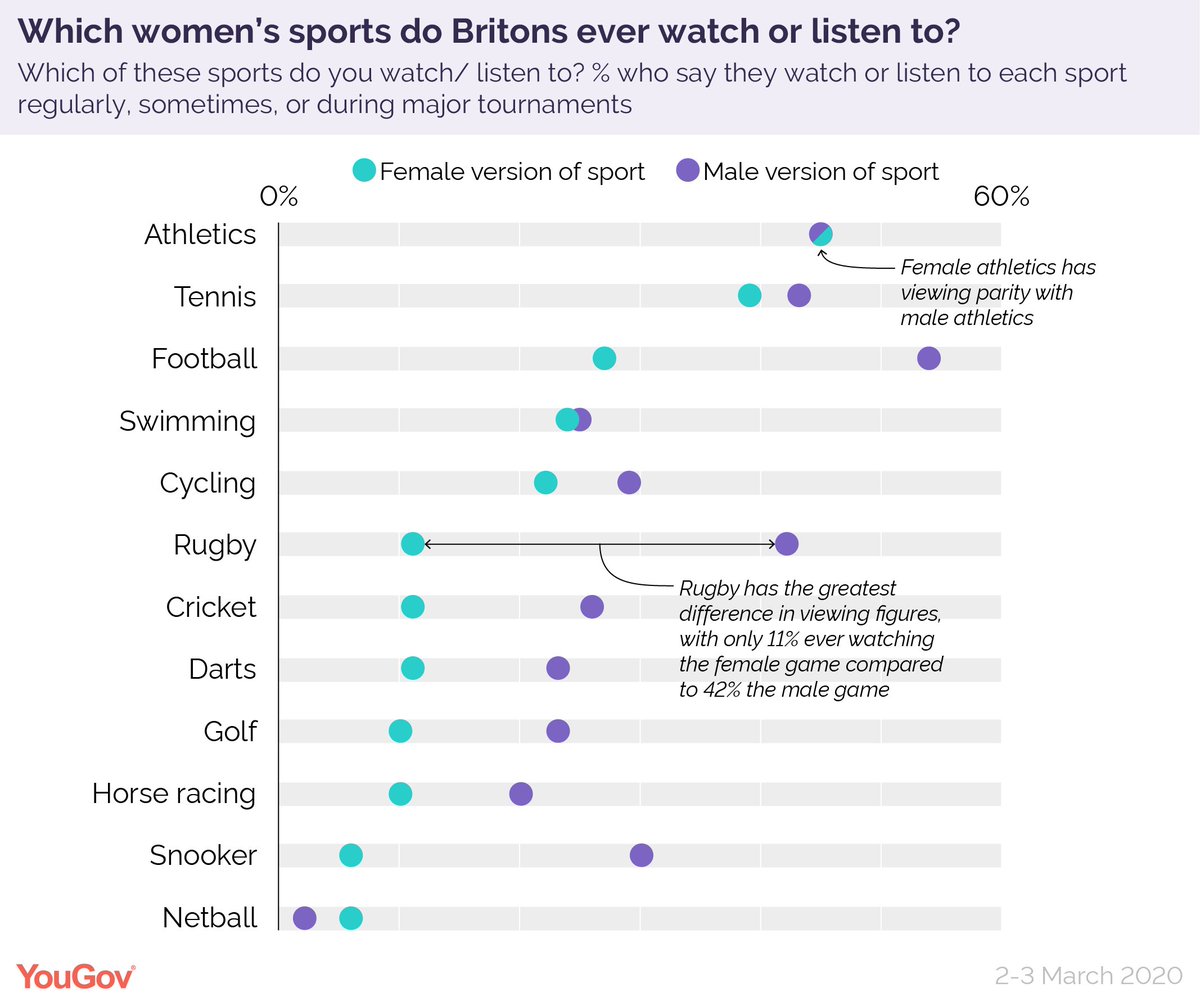
As things stand, only men's and women's athletics have viewing parity, with 45% of Brits saying they watch either sport. Tennis is close (43% watch men's tennis, 39% women's), while rugby has the greatest gap (42% men's, 11% women's) yougov.co.uk/topics/sport/a… Image

• • •

Missing some Tweet in this thread? You can try to force a refresh
 

Keep Current with YouGov

YouGov Profile picture

Stay in touch and get notified when new unrolls are available from this author!

Read all threads

This Thread may be Removed Anytime!

PDF

Twitter may remove this content at anytime! Save it as PDF for later use!

Try unrolling a thread yourself!

how to unroll video
  1. Follow @ThreadReaderApp to mention us!

  2. From a Twitter thread mention us with a keyword "unroll"
@threadreaderapp unroll

Practice here first or read more on our help page!

More from @YouGov

Feb 11
🧵/ Where does the British public stand on transgender rights in 2024/5?

The 4th study in our series shows that scepticism has grown across the board over the last two years, including among groups typically more sympathetic to trans people Image
On transgender social/legal status, % of Britons think...

Social
Should be able to identify as a different gender: 49% (-6 from 2022)
Should not be able to identify as a different gender: 35% (+10)

Legal
Law should allow people to change legal gender: 34% (-6)
Law should not allow people to change legal gender: 48% (+11)

yougov.co.uk/politics/artic…Image
As many Britons now say you should be able to change *neither* your social nor legal gender as say you should be able to change *both*

Should be able to change neither: 33% (+10 from 2022)
Should be able to change both: 32% (-6)
Change social, but not legal: 10% (-1)
Change social, unsure on legal: 7% (+1)
Unsure on both: 11% (-5)
Other combos: 8% (+1)

yougov.co.uk/politics/artic…Image
Read 11 tweets
Dec 27, 2024
Willingness to support Ukraine until such a time as Russia has withdrawn has fallen in Western Europe since early 2023

🇸🇪 50% (-7 since Feb 2023)
🇩🇰 40% (-11)
🇬🇧 36% (-14)
🇩🇪 28% (-7)
🇪🇸 25% (-12)
🇫🇷 23% (-14)
🇮🇹 17% (-11)

yougov.co.uk/politics/artic…Image
While Western Europeans are much more likely to want Ukraine to win than Russia, the number who do so AND care a great/fair amount about it has fallen noticeably in some countries since early 2023

🇸🇪 74% (-2 since Feb 2023)
🇩🇰 73% (+1)
🇬🇧 62% (-10)
🇩🇪 48% (-5)
🇫🇷 43% (-1)
🇪🇸 38% (-17)
🇮🇹 29% (-11)

yougov.co.uk/politics/artic…Image
With Donald Trump due to become president again in January, Western Europeans typically expect that he will end support to Ukraine – although they are less sure whether he will follow through on threats to withdraw from NATO

yougov.co.uk/politics/artic…Image
Read 6 tweets
Sep 24, 2024
Labour and Keir Starmer's favourability ratings have fallen to a new post-election low

Keir Starmer
Favourable: 30% (-14 from 8 Jul)
Unfavourable: 60% (+13)

Labour party
Favourable: 32% (-15)
Unfavourable: 59% (+13)

yougov.co.uk/politics/artic…
Image
Negative attitudes towards Labour have not crystallised just yet. Most Britons (54%) still say they are willing to give the new government the benefit of the doubt

Have high hopes, think they will do well: 19% (-2 from 20 Jun)
Do not have high hopes, but give benefit of doubt: 35% (=)
Do not have high hopes, think they will do badly: 38% (+5)

yougov.co.uk/politics/artic…Image
Nevertheless, many Britons feel let down by Labour. 23% say they expected them to do well in government, but have been disappointed so far

Expected to be bad, and they have: 39%
Expected to be good, but have been disappointed: 23%
Expected to be bad, but have been better than expected: 3%
Expected to be good, and they have: 11%

yougov.co.uk/politics/artic…Image
Read 5 tweets
Sep 17, 2024
25 years after devolution for Scotland, and 10 years after the independence referendum, what constitutional set-up do Scots support having?

Devolution, more powers: 51% support
Devolution, current powers: 46%
Autonomy within UK: 42%
Full independence: 41%
Abolition of devolution: 21%
Devolution, fewer powers: 19%

yougov.co.uk/politics/artic…Image
Which constitutional set-ups for Scotland are popular with the different parties?

Top 3 with 2024 Labour voters
Devolution, current powers: 56% support
Devolution, more powers: 43%
Autonomy within UK: 35%

Top 3 with 2024 SNP voters
Full independence: 85%
Devolution, more powers: 85%
Autonomy within UK: 67%

Top 3 with 2024 Conservative voters
Abolition of devolution: 58%
Devolution, fewer powers: 51%
Devolution, current powers: 41%

yougov.co.uk/politics/artic…Image
In Wales, existing or enhanced devolution are also the most popular options, though 31% would support abolishing devolution

Devolution, more powers: 40% support
Devolution, current powers: 39%
Autonomy within UK: 32%
Abolition of devolution: 31%
Full independence: 24%
Devolution, fewer powers: 23%

yougov.co.uk/politics/artic…Image
Read 4 tweets
Sep 17, 2024
With the 10 year anniversary of the Scottish independence referendum tomorrow, support for 'Yes' and 'No' among voters stands at effectively the same level as a decade ago

No: 56% (+1 from 2014)
Yes: 44% (-1)

yougov.co.uk/politics/artic…
Image
But 'No' supporters are less likely to say their view on Scottish independence is strongly held

% saying their views are strongly held:
All Scots: 73%
Yes supporters: 90%
No supporters: 78%

yougov.co.uk/politics/artic…Image
'Yes' voters are more likely to have changed their minds since 2014, but are being replenished by younger voters who lean towards Scottish independence

All Scots
Yes: 37%
No: 47%

2014 Yes voters
Yes: 70%
No: 18%

2014 No voters
Yes: 11%
No: 79%

16-24 year olds
Yes: 39%
No: 31%

yougov.co.uk/politics/artic…Image
Read 7 tweets
Aug 27, 2024
A hypothetical merger of the Conservatives and Reform UK divides the Tory membership, four in ten supportive and half opposed

% of Conservative members...
Support: 42%
Oppose: 51%

yougov.co.uk/politics/artic…
Image
Nonetheless, most Conservative members feel the party should move to the right and primarily target Reform UK voters over the next parliament

% of Conservative members saying party should...
Move to right: 51%
Move to centre: 34%
Stay where it is: 12%

% saying party should primarily target...
Reform UK voters: 50%
Labour voters: 25%
Lib Dem voters: 16%
Some other group: 4%

yougov.co.uk/politics/artic…Image
Two-thirds of Conservative members want to be able to vote on policy at conference and be able to vote on all leadership candidates, with six in ten also wanting to elect a deputy leader

yougov.co.uk/politics/artic…
Image
Read 4 tweets

Did Thread Reader help you today?

Support us! We are indie developers!


This site is made by just two indie developers on a laptop doing marketing, support and development! Read more about the story.

Become a Premium Member ($3/month or $30/year) and get exclusive features!

Become Premium

Don't want to be a Premium member but still want to support us?

Make a small donation by buying us coffee ($5) or help with server cost ($10)

Donate via Paypal

Or Donate anonymously using crypto!

Ethereum

0xfe58350B80634f60Fa6Dc149a72b4DFbc17D341E copy

Bitcoin

3ATGMxNzCUFzxpMCHL5sWSt4DVtS8UqXpi copy

Thank you for your support!

Follow Us!

:(