What does it mean that 20% of hospitalizations are in patients 20-44 years?
An EPI 101 tutorial on how to interpret this widely circulated figure.
An EPI 101 tutorial on how to interpret this widely circulated figure.

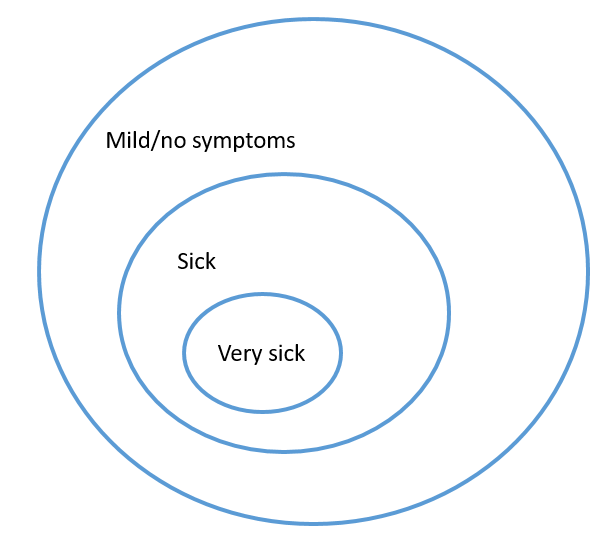
Number of hospitalizations per age group depends on a few key quantities:
(1) Size of the age group (how many people are that age?)
(2) Probability of infection in that age group (how often are you exposed?)
(3) Probability of hospitalization once infected in that age group
(1) Size of the age group (how many people are that age?)
(2) Probability of infection in that age group (how often are you exposed?)
(3) Probability of hospitalization once infected in that age group
Importantly, the age groups shown are not all the same size, not least of all because some age groups span more years than others.
Using population data from NYC, the breakdowns are roughly as shown.
NB: I am ignoring 0-19 yrs, so these don’t add to 100%. Not a mistake!
Using population data from NYC, the breakdowns are roughly as shown.
NB: I am ignoring 0-19 yrs, so these don’t add to 100%. Not a mistake!

The next step is... what is the probability of being infected for each group?
Let’s assume everyone is similarly susceptible (though not everyone develops symptoms).
Then this will depend on who is exposed. Who has multiple roommates? Who is riding the subway?
Let’s assume everyone is similarly susceptible (though not everyone develops symptoms).
Then this will depend on who is exposed. Who has multiple roommates? Who is riding the subway?
There are many great studies of social mixing patterns by age group. Check out this recent example.
Younger adults generally have more interaction w/ others than older adults. So maybe younger adults are also more likely to be infected?
Younger adults generally have more interaction w/ others than older adults. So maybe younger adults are also more likely to be infected?
We would need serological (antibody) data to figure out how frequently different age groups are being infected.
Without this data, we will assume that this probability of infection is similar across age groups for our little example.
Without this data, we will assume that this probability of infection is similar across age groups for our little example.
The next layer is the one we are most interested in. What is the probability of being hospitalized given infection?
Without a good understanding of how many people are infected, we can’t directly calculate this.
But we can use the data to infer *relative* probabilities.
Without a good understanding of how many people are infected, we can’t directly calculate this.
But we can use the data to infer *relative* probabilities.
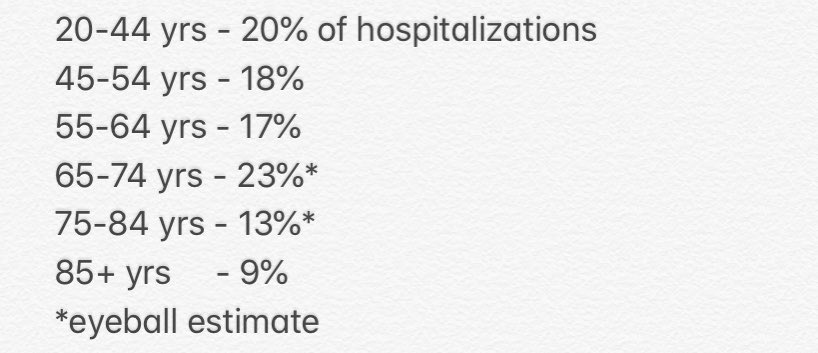
These are roughly the percentages displayed in our figure of interest.
20% of hospitalizations were in adults 20-44 years of age, versus only 9% in adults over 85 years. Again, I’m ignoring those under 20 (<1% of hospitalizations).
cdc.gov/mmwr/volumes/6…
20% of hospitalizations were in adults 20-44 years of age, versus only 9% in adults over 85 years. Again, I’m ignoring those under 20 (<1% of hospitalizations).
cdc.gov/mmwr/volumes/6…
Let’s standardize these percentages by how many people are actually in these age bands. This is achieved by simply dividing the numbers.

Now let’s further standardize by setting the youngest age band as the reference group. Now we have something we can start to interpret.
85 year olds are roughly 9 times as likely to be hospitalized as younger adults.
85 year olds are roughly 9 times as likely to be hospitalized as younger adults.

So these rough data are consistent w/ our understanding that older age groups are at highest risk.
What was striking to me was that we saw so many younger adults hospitalized at all! Hence the accurate conclusion that millennials are not invincible.
statnews.com/2020/03/18/cor…
What was striking to me was that we saw so many younger adults hospitalized at all! Hence the accurate conclusion that millennials are not invincible.
statnews.com/2020/03/18/cor…
Caveats about these calculations. Done one-handed on iPhone notes app & calculator while holding a baby. Includes eyeball estimates, rounding, small numbers.
But I hope it provides a useful tutorial on how we evaluate the data to learn something about the epidemiology. END
But I hope it provides a useful tutorial on how we evaluate the data to learn something about the epidemiology. END