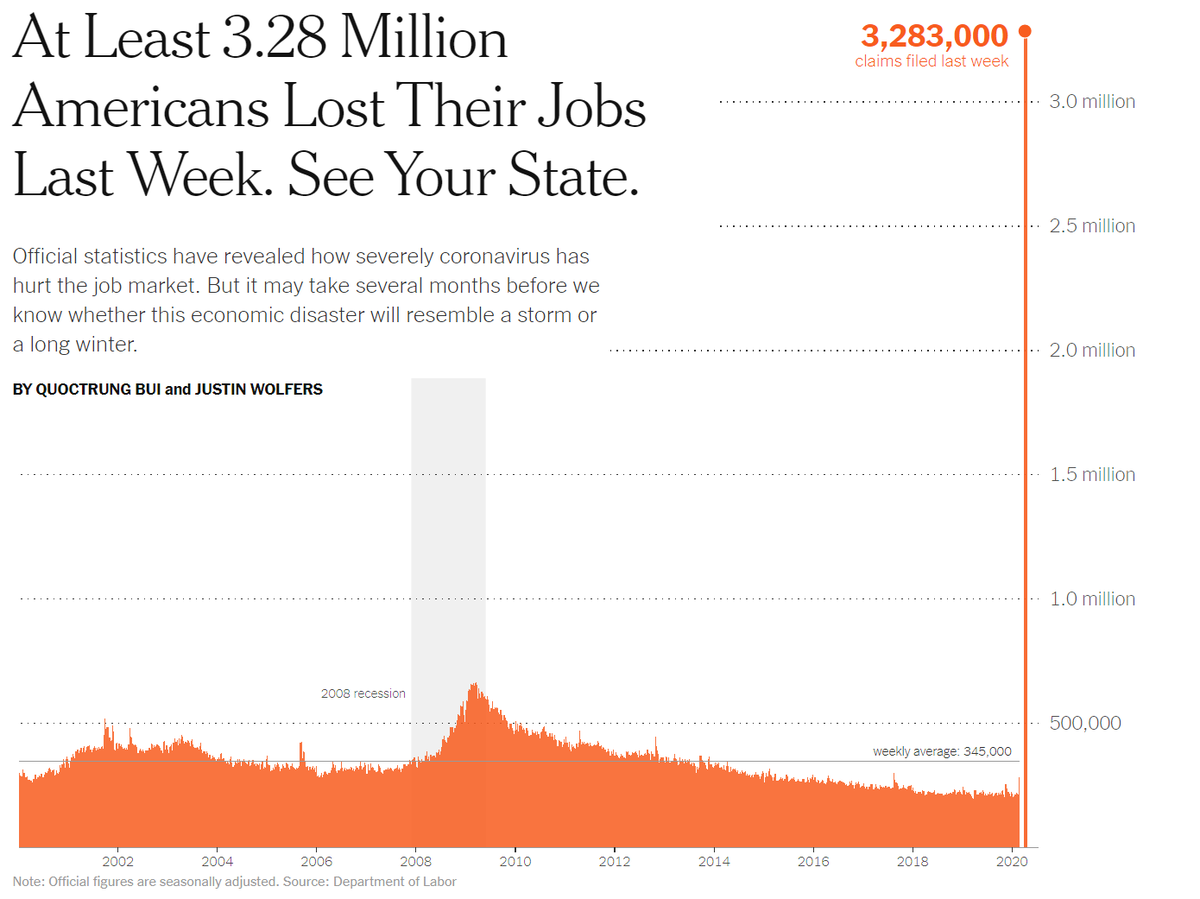
My latest with @qdbui for @UpshotNYT: The usual economic indicators can't keep up when the economy is shifting this fast. So we turn to electricity data which suggests the economy has sunk further over the past 3 weeks than over the entire Great Recession.
nytimes.com/interactive/20…
nytimes.com/interactive/20…
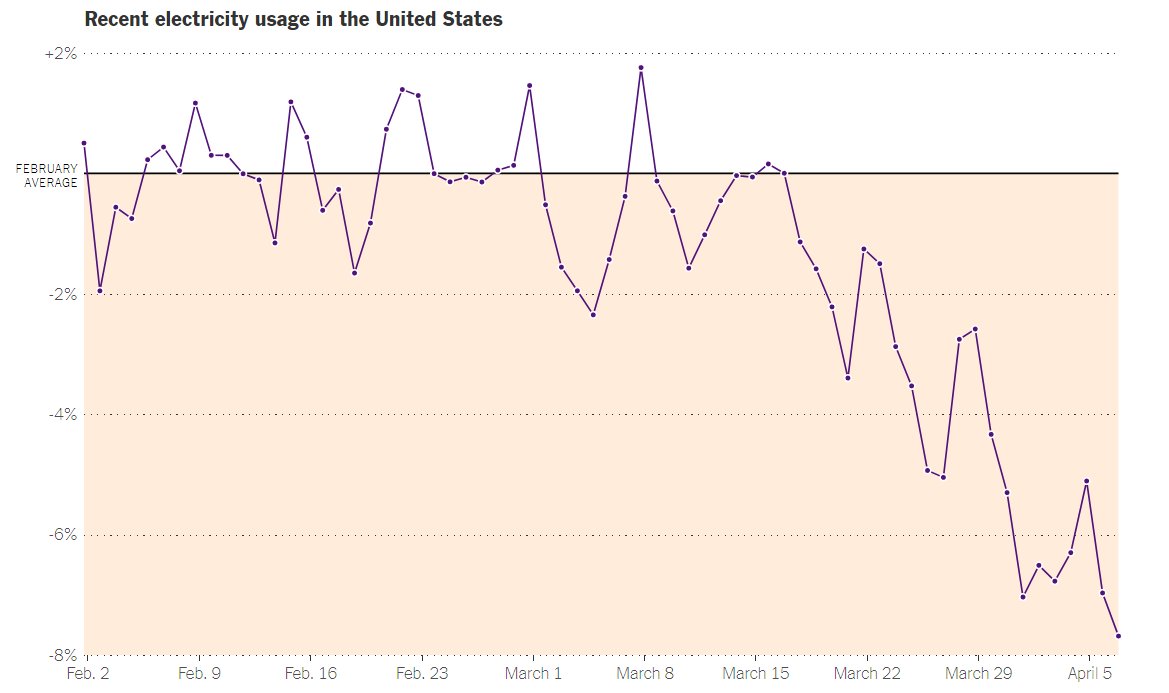
Here's the problem: The economy has never changed this fast before. The unemployment rate is moving as much every two days as it typically moves in a year.
So we need economic indicators that can tell us what's happening across the whole economy, day by day.
So we need economic indicators that can tell us what's happening across the whole economy, day by day.
Economist @SteveCicala saw the need for high-quality daily data some time ago, and he's been working to put together estimates of electricity usage which strip out the effects of weather and seasonal factors.
He's the one who has put together this amazing data.
He's the one who has put together this amazing data.
And guess what? This new indicator works.
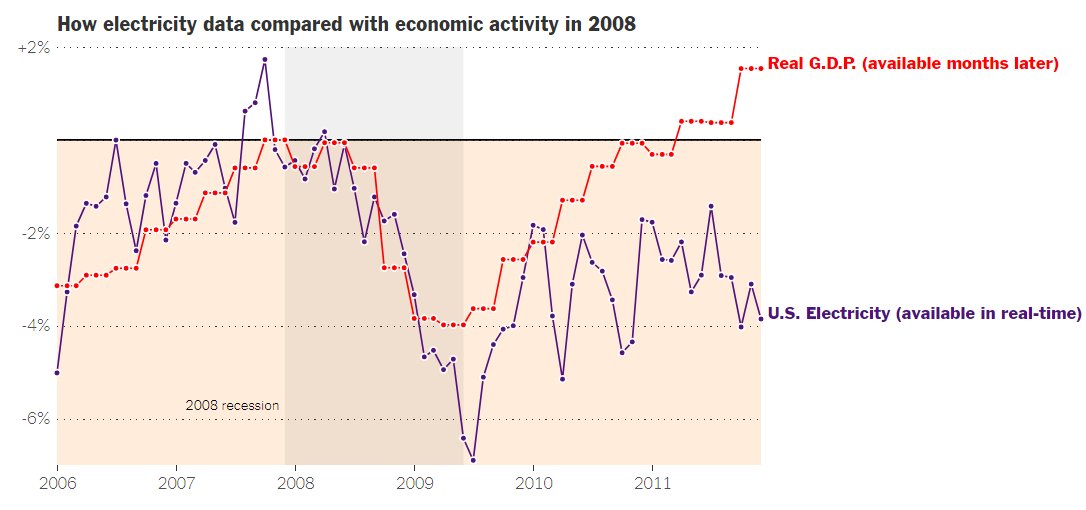
Recall the days after Lehman collapsed in Sept '08. Electricity use immediately cratered. But it took months -- and many revisions -- for the official stats like GDP or payrolls to pick up the carnage.
Recall the days after Lehman collapsed in Sept '08. Electricity use immediately cratered. But it took months -- and many revisions -- for the official stats like GDP or payrolls to pick up the carnage.
So what do these new data tell us?
1. The US downturn is already deeper than the Great Recession.
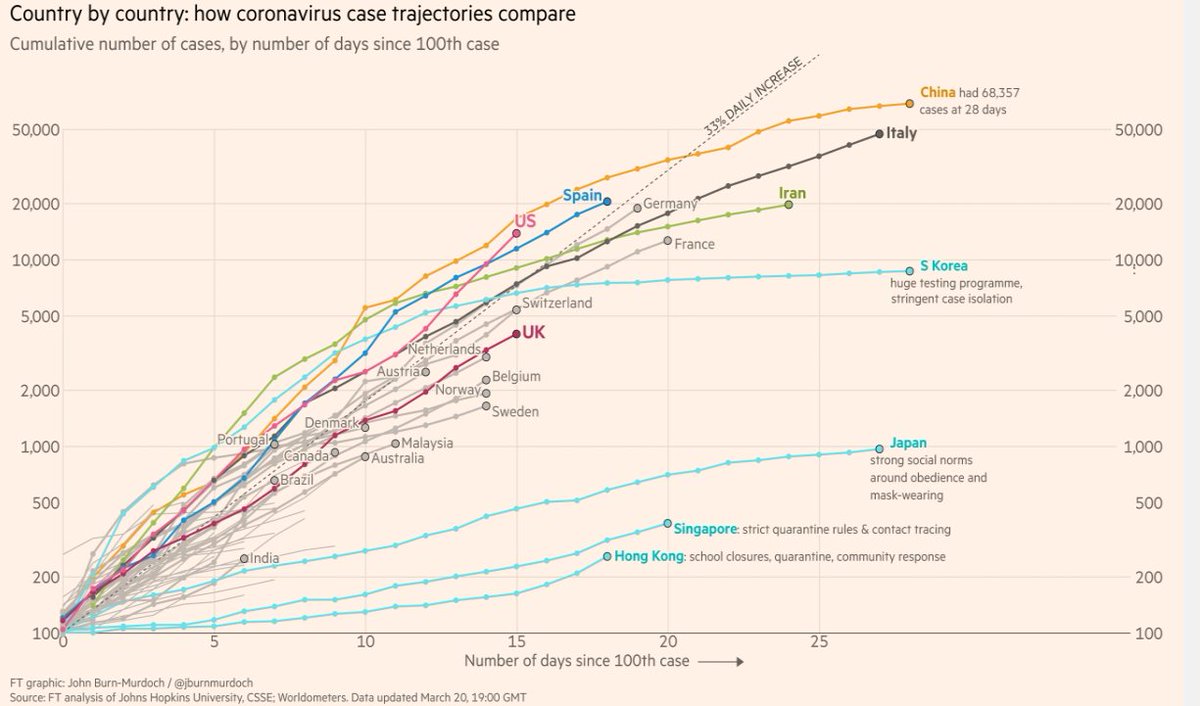
2. Covid hit Europe first, and the U.S. has been tracking Europe with a lag. If this continues, the U.S. economy will fall further.
3. If it gets as bad as Italy, look out below.
1. The US downturn is already deeper than the Great Recession.
2. Covid hit Europe first, and the U.S. has been tracking Europe with a lag. If this continues, the U.S. economy will fall further.
3. If it gets as bad as Italy, look out below.

Caveats?
I've got a few.
Eliminating seasonality from daily data is hard. So don't rely too much on any data point
The isolation economy is different from the pre-pandemic one, so who knows if past relationships will persist
Different sectors use diff amounts of electricity
I've got a few.
Eliminating seasonality from daily data is hard. So don't rely too much on any data point
The isolation economy is different from the pre-pandemic one, so who knows if past relationships will persist
Different sectors use diff amounts of electricity
I'm not arguing that electricity is perfect, but today, it may be the least bad alternative.
It's broad-based, well-measured, available daily, and updated almost immediately.
It's useful for high-frequency analysis, less useful over longer periods where more reliable data exist
It's broad-based, well-measured, available daily, and updated almost immediately.
It's useful for high-frequency analysis, less useful over longer periods where more reliable data exist
From the department of everything-that-was-old-is-new-again: My favorite economic historian, @jhausma1, tells me that during the Great Depression electricity production was used as a high-frequency economic indicator, and the numbers were published each week by the Commerce Dept.