(ft.com/content/a26fbf…)
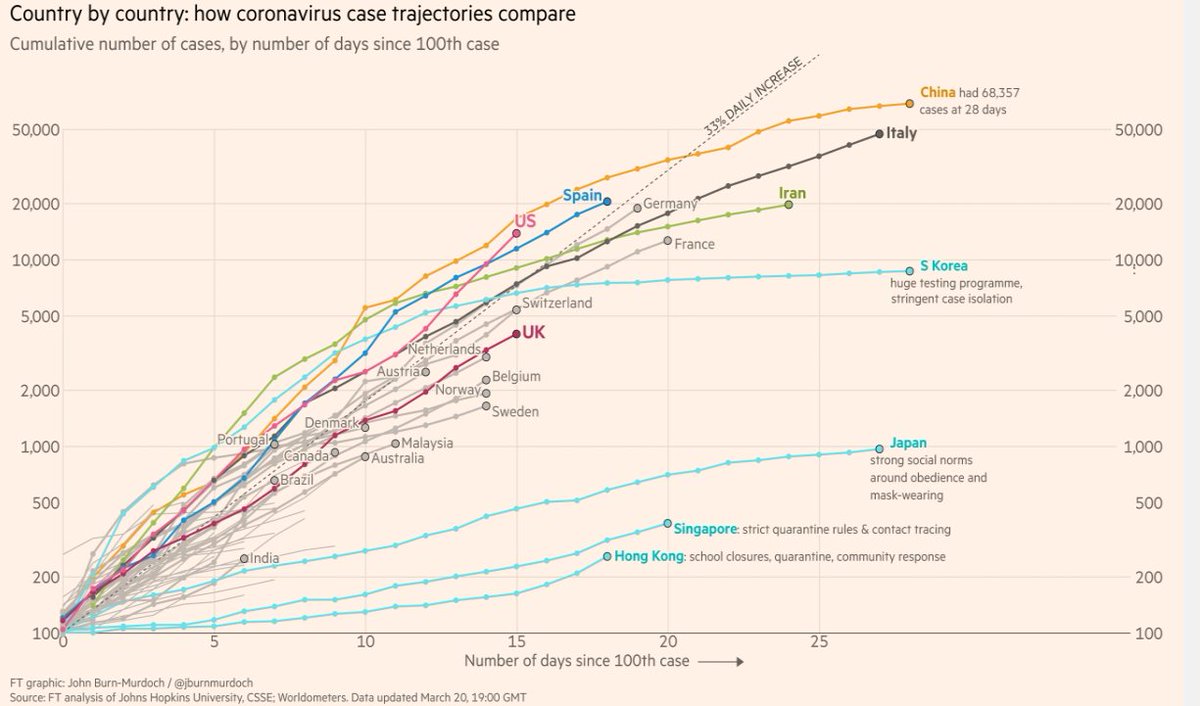
Longer answer: Let's learn about logs.
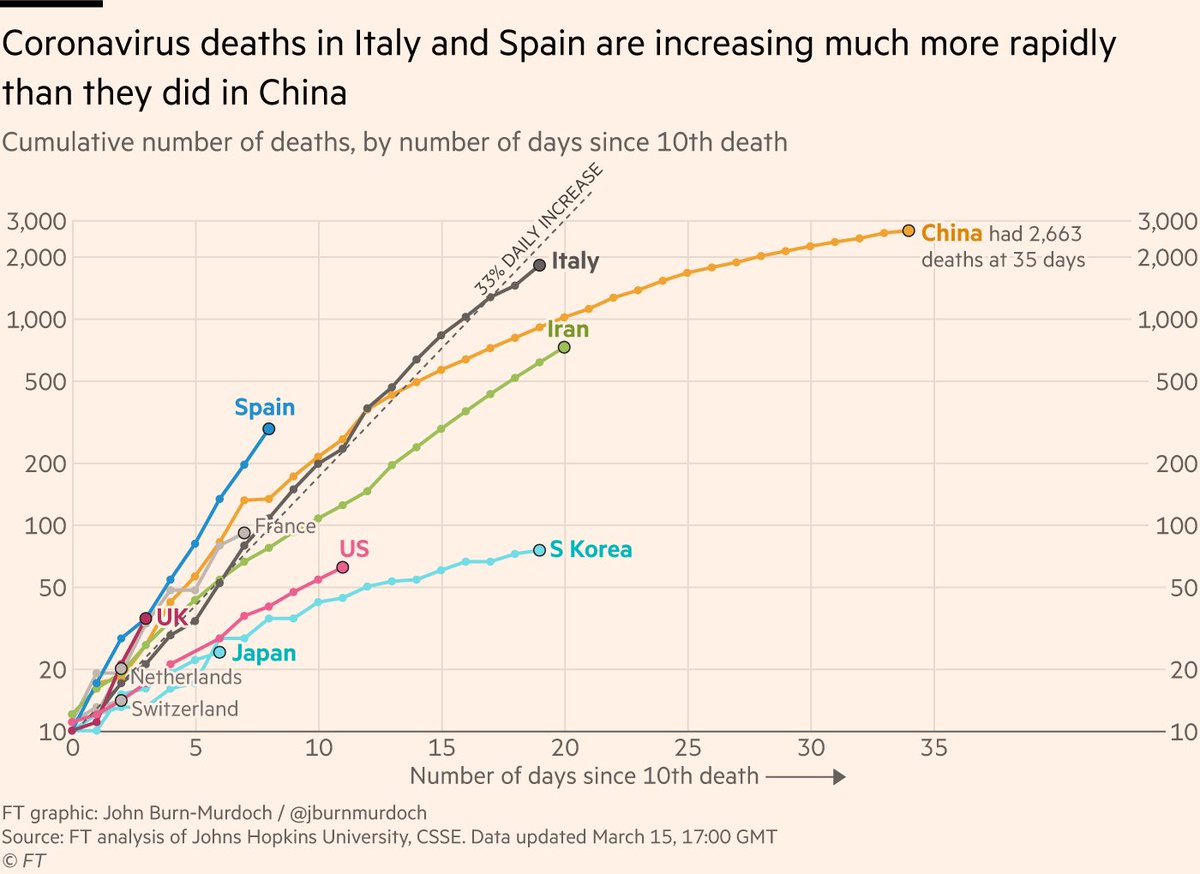
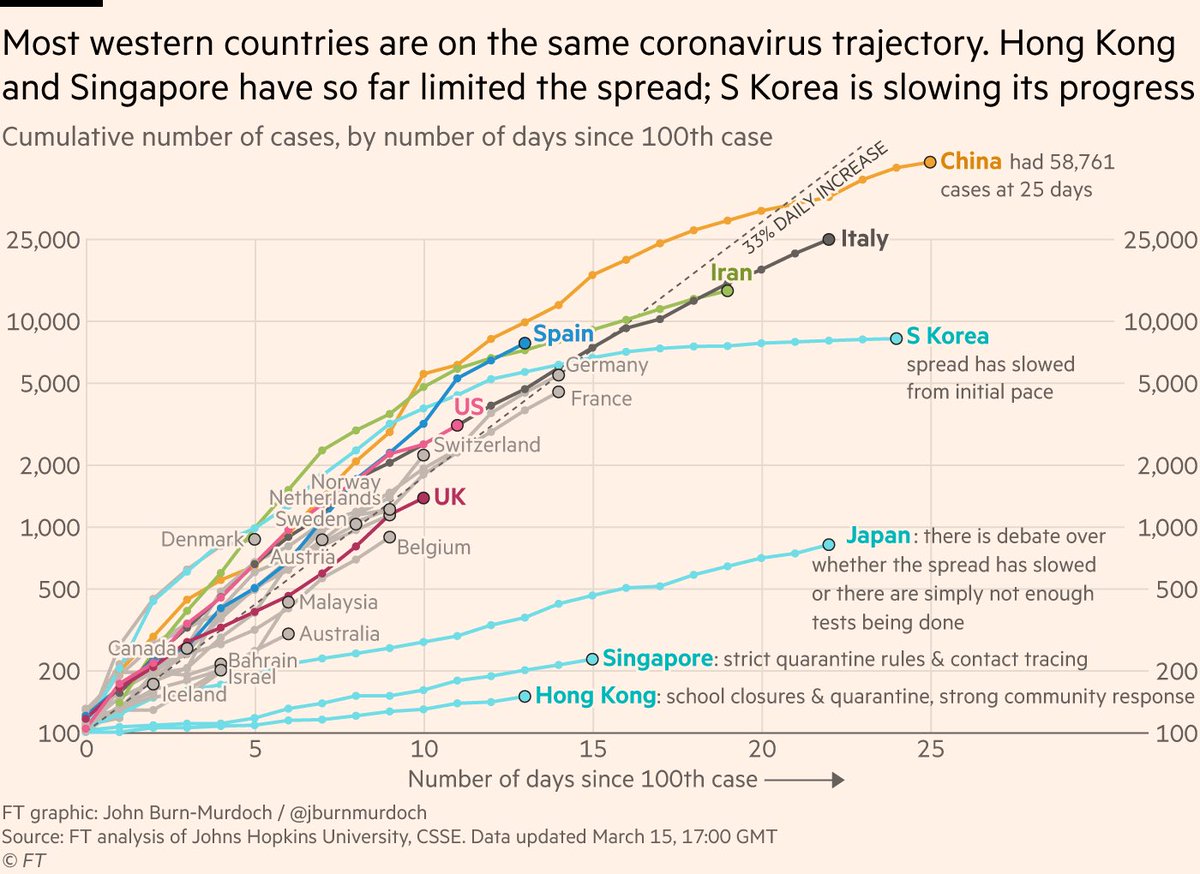
A per capita graph shows log(cases/population) which = log(cases)-log(population).
Total population is barely moving day to day, so this is like log(cases)-constant.
And that means the story doesn't change, because it's the slope that people use to extrapolate bad outcomes becoming dramatically worse.


