
1/ I have a theory about what is going on here...
One key difference in the updated IHME model is a new assumed value of a key parameter. This is the ratio of hospitalizations to deaths.
In the original version, it was assumed there were 11.1 hospitalizations for each death.
One key difference in the updated IHME model is a new assumed value of a key parameter. This is the ratio of hospitalizations to deaths.
In the original version, it was assumed there were 11.1 hospitalizations for each death.
2/ With new data, this was updated to 7.1.
Importantly, this means that patients are doing WORSE (more deaths).
But this has the counter-intuitive effect of making things look BETTER. For the same number of deaths, fewer people will be hospitalized.
Importantly, this means that patients are doing WORSE (more deaths).
But this has the counter-intuitive effect of making things look BETTER. For the same number of deaths, fewer people will be hospitalized.
3/ That is because the model fits a curve to deaths and then uses this curve to extrapolate backwards how many people are hospitalized and need ventilators.
Multiplying by 7.1 will suggest smaller need than multiplying by 11.1.
Multiplying by 7.1 will suggest smaller need than multiplying by 11.1.
4/ From their document: "These lower ratios of admissions to deaths result in predicted peak hospital resource use – total beds, ICU beds, and invasive ventilators – that is lower than previously estimated."
5/ But something in this is strange to me. Wouldn't we be better off with a HIGHER ratio of hospitalizations to deaths? This would mean more people are surviving.
For example, in Germany, many more people are hospitalized early on in illness and tend to do better as a result.
For example, in Germany, many more people are hospitalized early on in illness and tend to do better as a result.
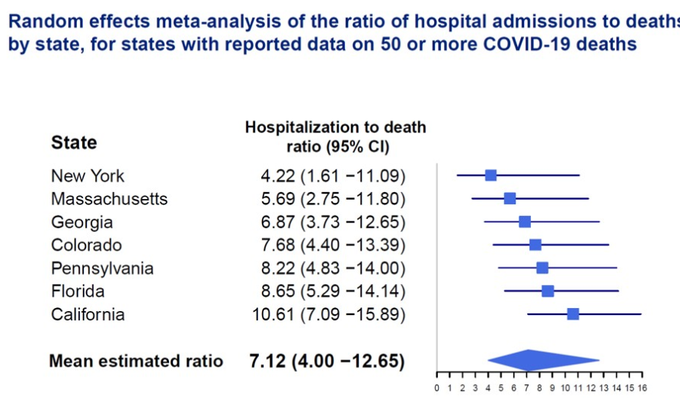
6/ I believe that IHME is using a random effects model to allow this ratio to vary by state. They provide a figure with some state-by-state data. Notably, the hardest hit states have the LOWEST ratio. 4.22 in New York versus 10.61 in California. 
7/ When I see this, I infer that patients in hardest hit states are accessing care too late.
So my theory is that the forecasts reflect these state-by-state differences, and this is why hardest hit states seem to paradoxically do better. They need a smaller extrapolation factor.
So my theory is that the forecasts reflect these state-by-state differences, and this is why hardest hit states seem to paradoxically do better. They need a smaller extrapolation factor.
8/ But putting my public health hat on, is this the appropriate approach? Wouldn't it be better to say we want all states to achieve a particular ratio (e.g. 11 hospitalizations to 1 death) that is consistent with higher quality care?
9/9 So that is my working hypothesis. I hope people can help fill in the gaps. For example, while it's clear to me why this assumption would change numbers hospitalized, I am not sure why it affects forecasted numbers of deaths. But maybe it can help get the discussion going.
Tagging @yuorme who initially posed the question.

