Update 10 April (thread)
1.335 new confirmed cases (total: 23.097)
115 new fatalities (total: 2.511)
225 new hospitalisations (total: 8.197)
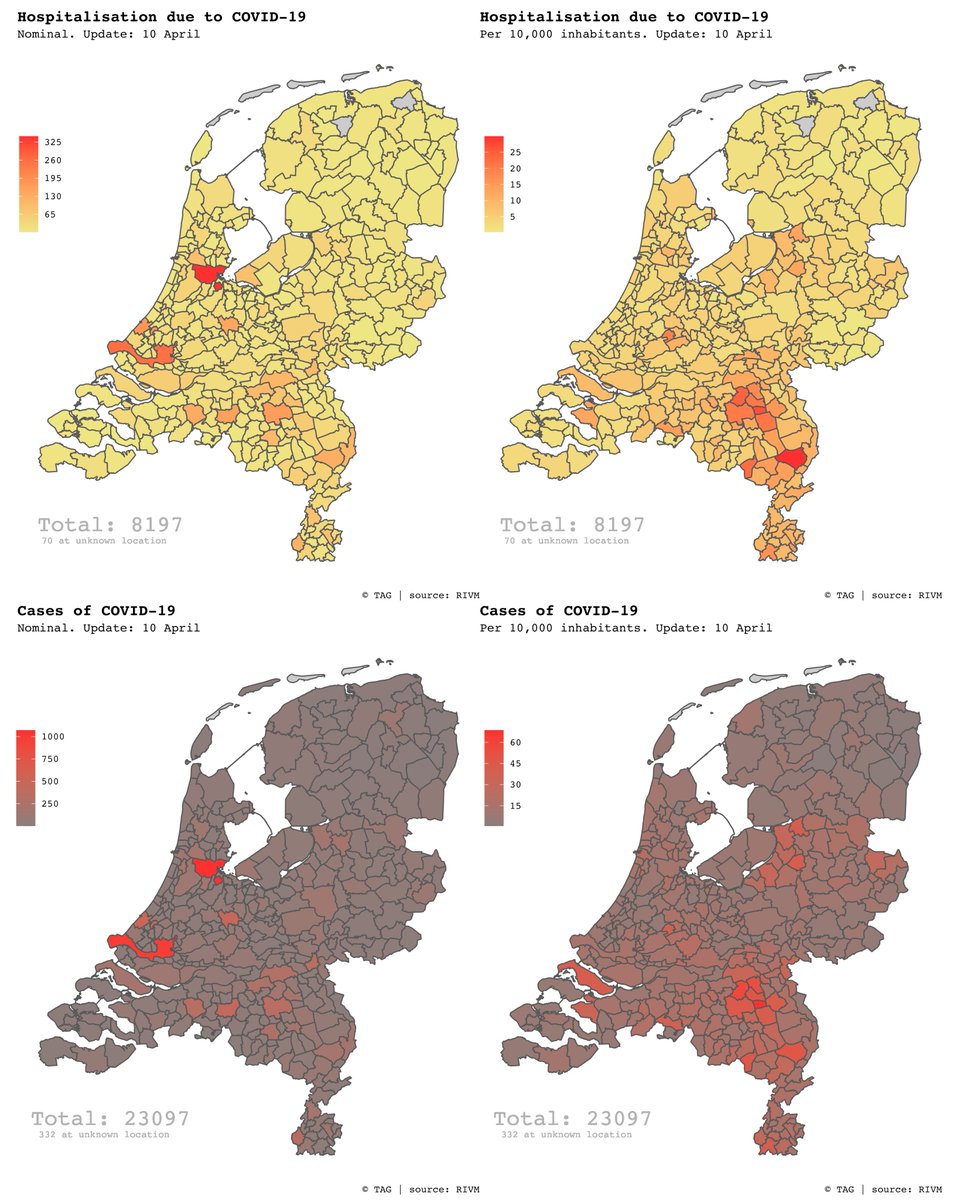
Map shows cases and hospitalisations per Dutch municipality.
#coronakaart #coronavirusNL #COVID19NL
1.335 new confirmed cases (total: 23.097)
115 new fatalities (total: 2.511)
225 new hospitalisations (total: 8.197)
Map shows cases and hospitalisations per Dutch municipality.
#coronakaart #coronavirusNL #COVID19NL
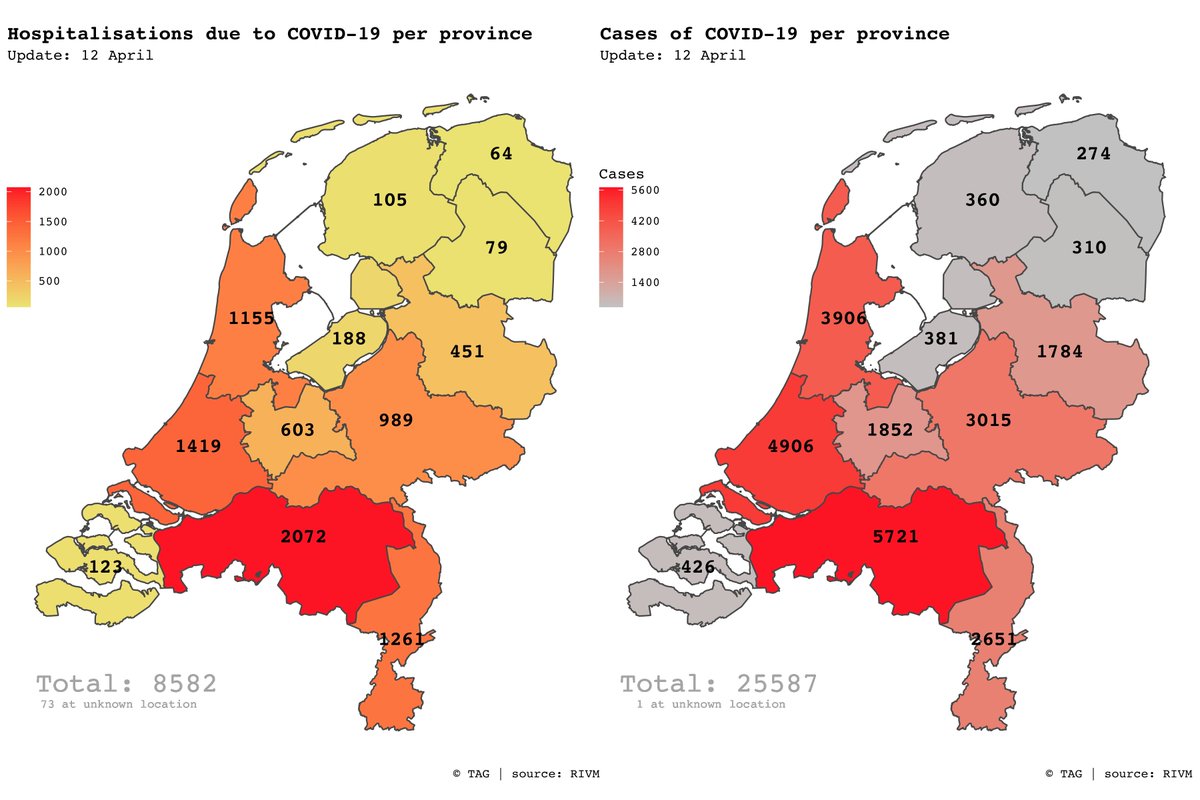
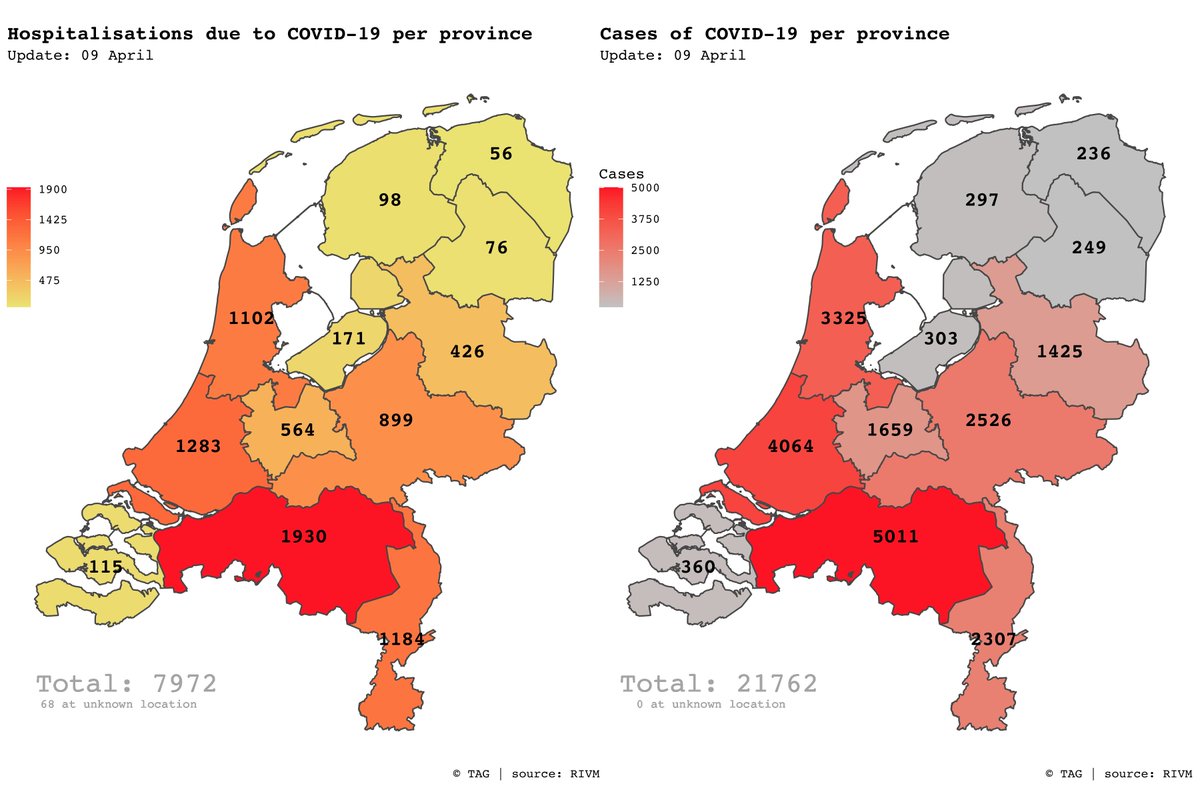
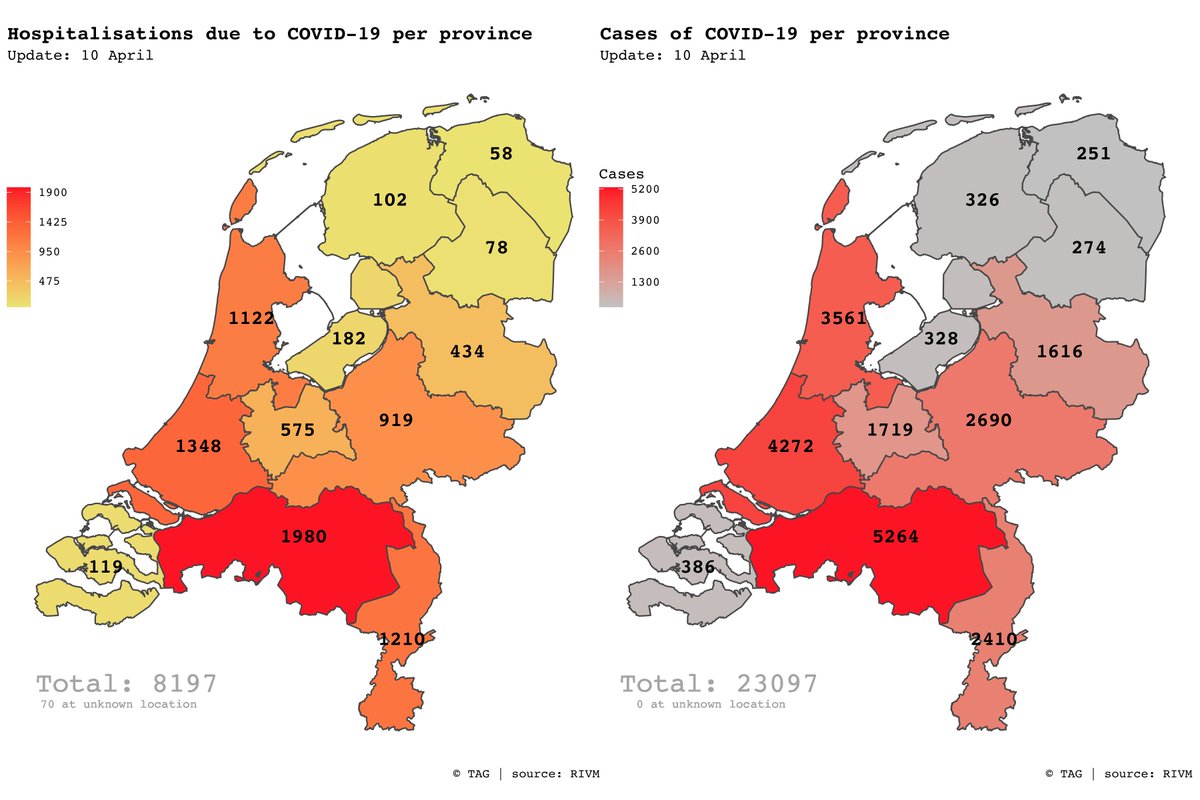
Total number of hospitalisations and cases of #COVIDー19 per Dutch province:
#coronanederland #coronakaart #coronavirusNL
#coronanederland #coronakaart #coronavirusNL
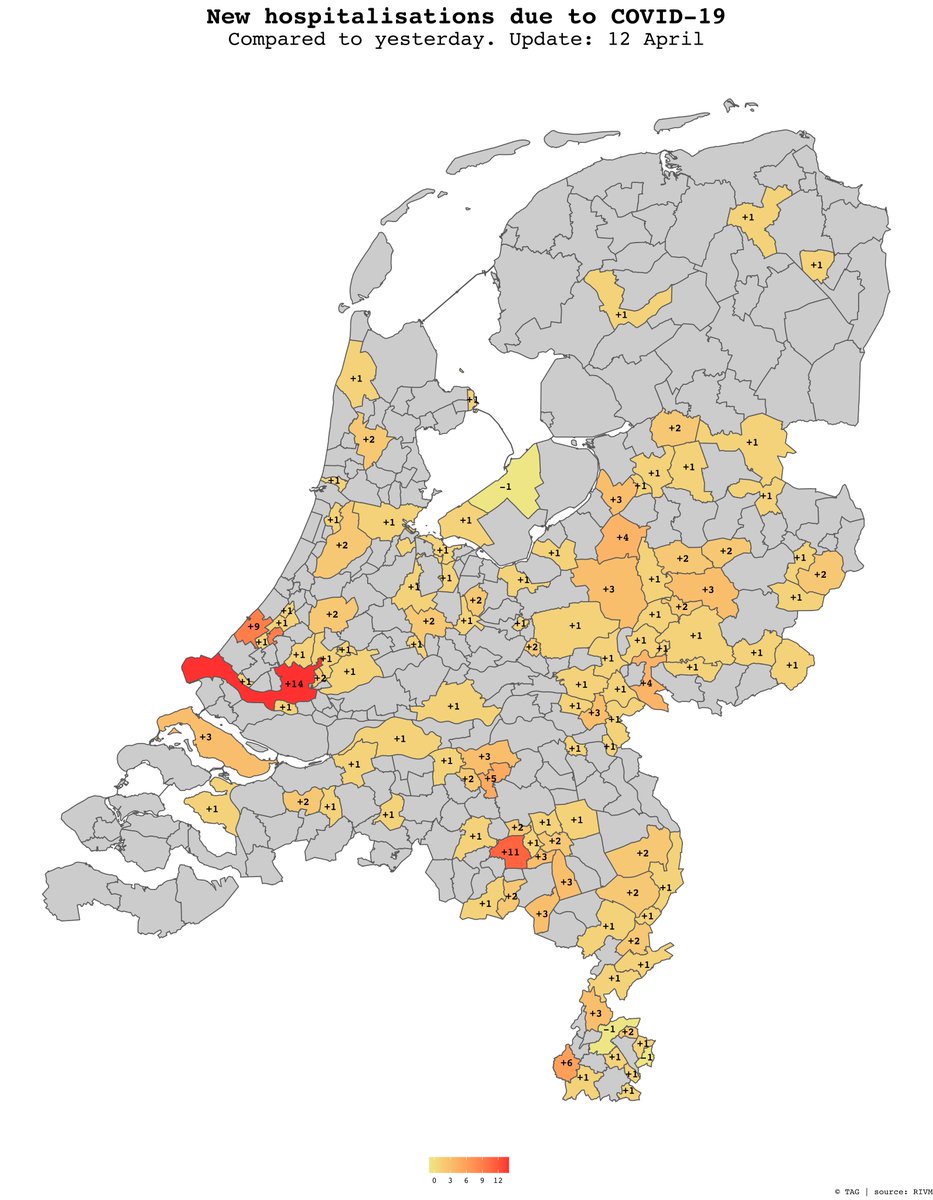
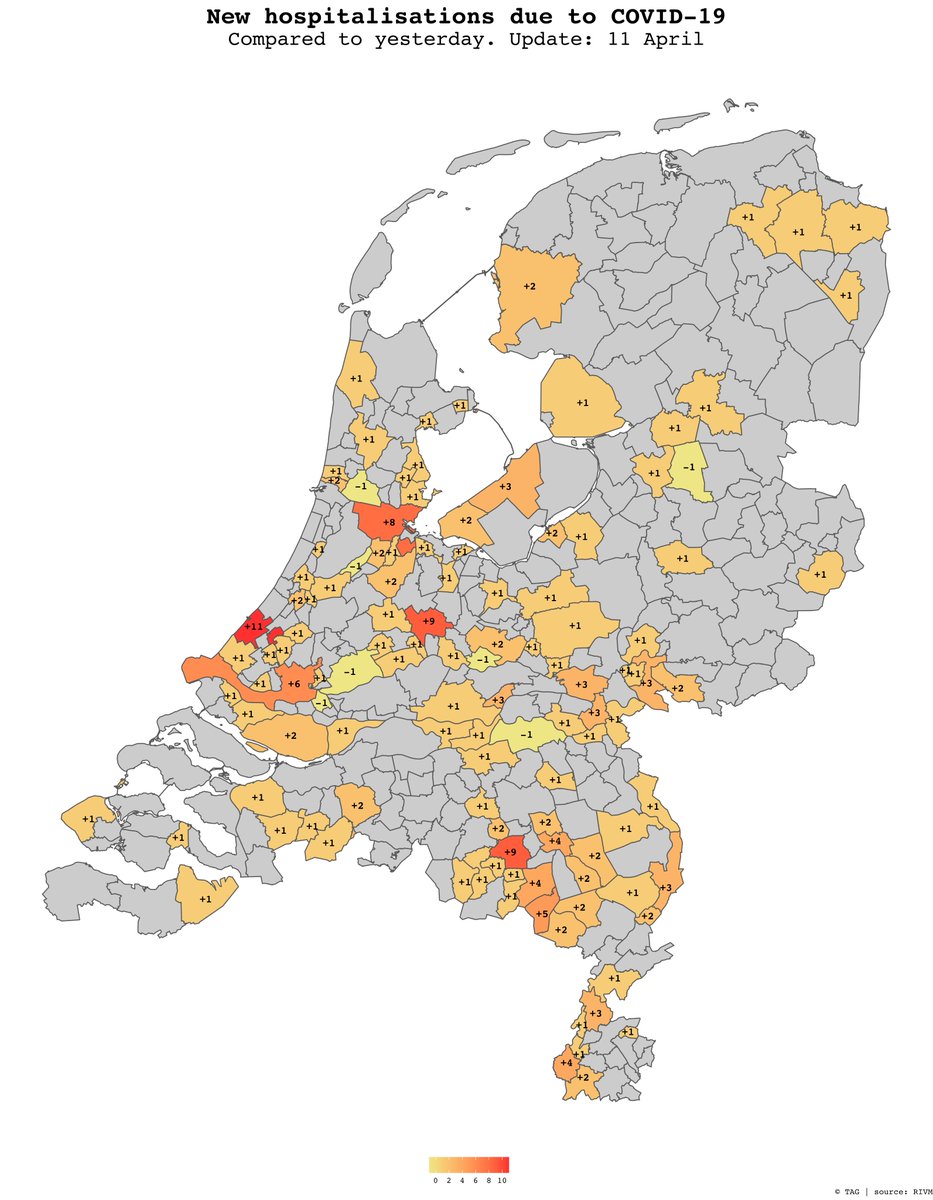
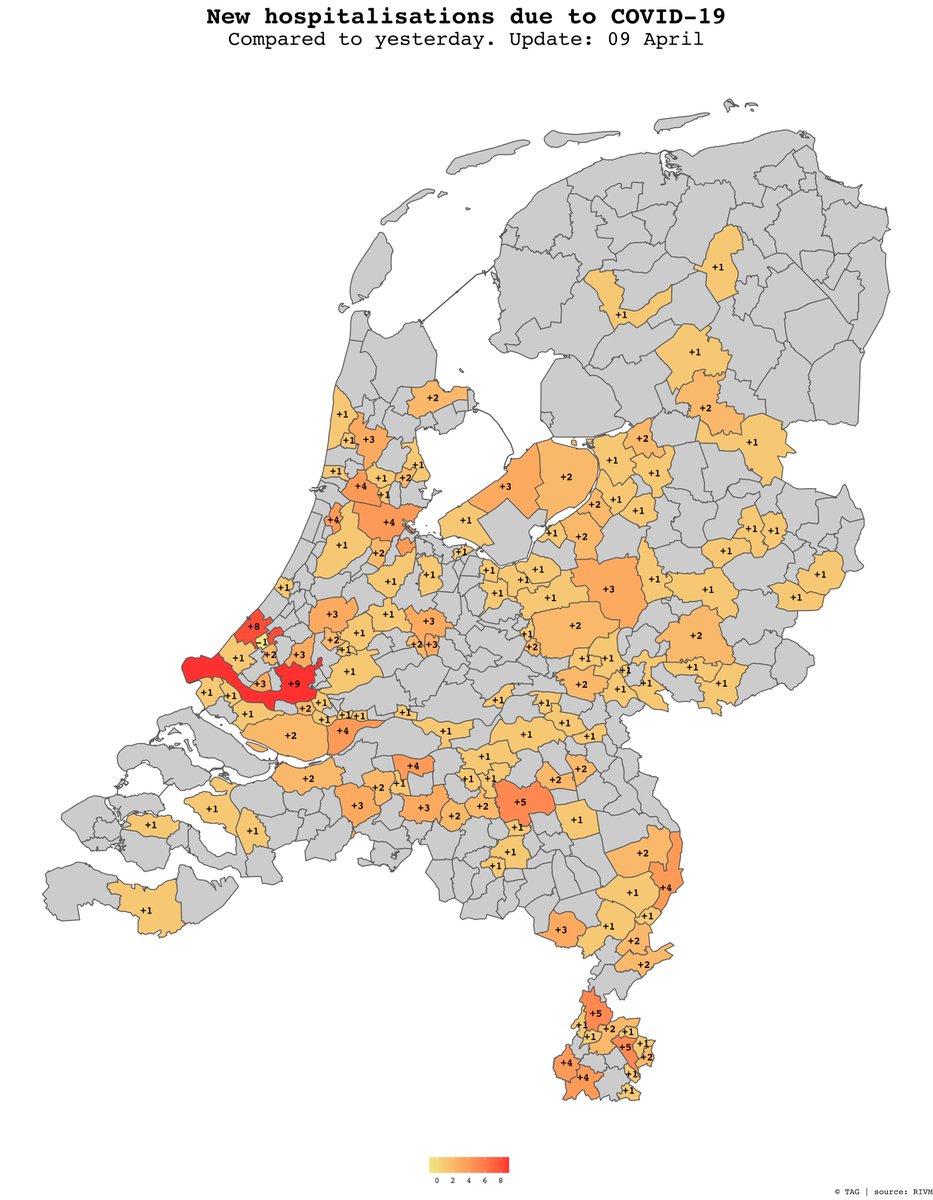
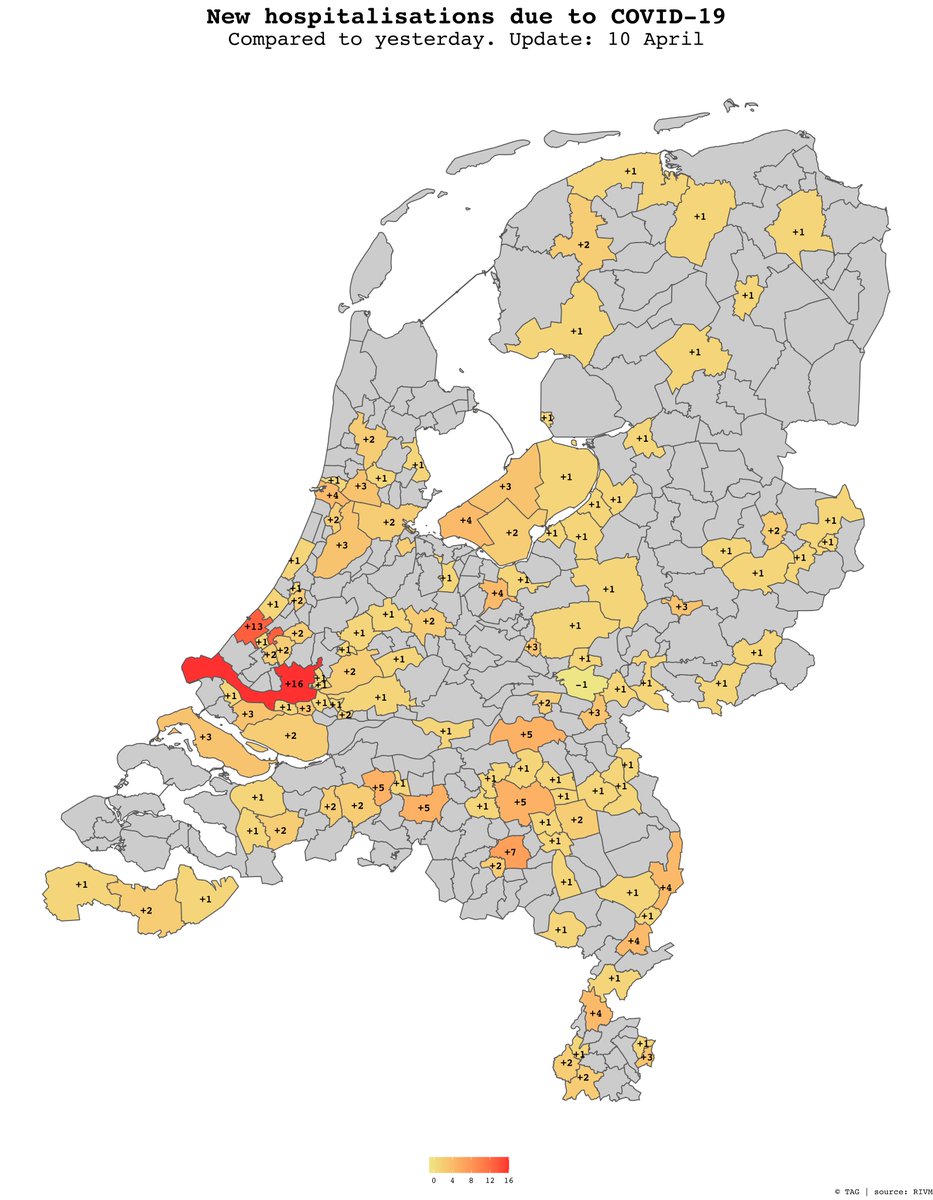
114 municipalities report at least one new hospitalisation due to #COVIDー19.
Biggest increase in Rotterdam (+16), 's-Gravenhage (+13) and Eindhoven (+7).
#coronkaart #coronavirusNL
Biggest increase in Rotterdam (+16), 's-Gravenhage (+13) and Eindhoven (+7).
#coronkaart #coronavirusNL
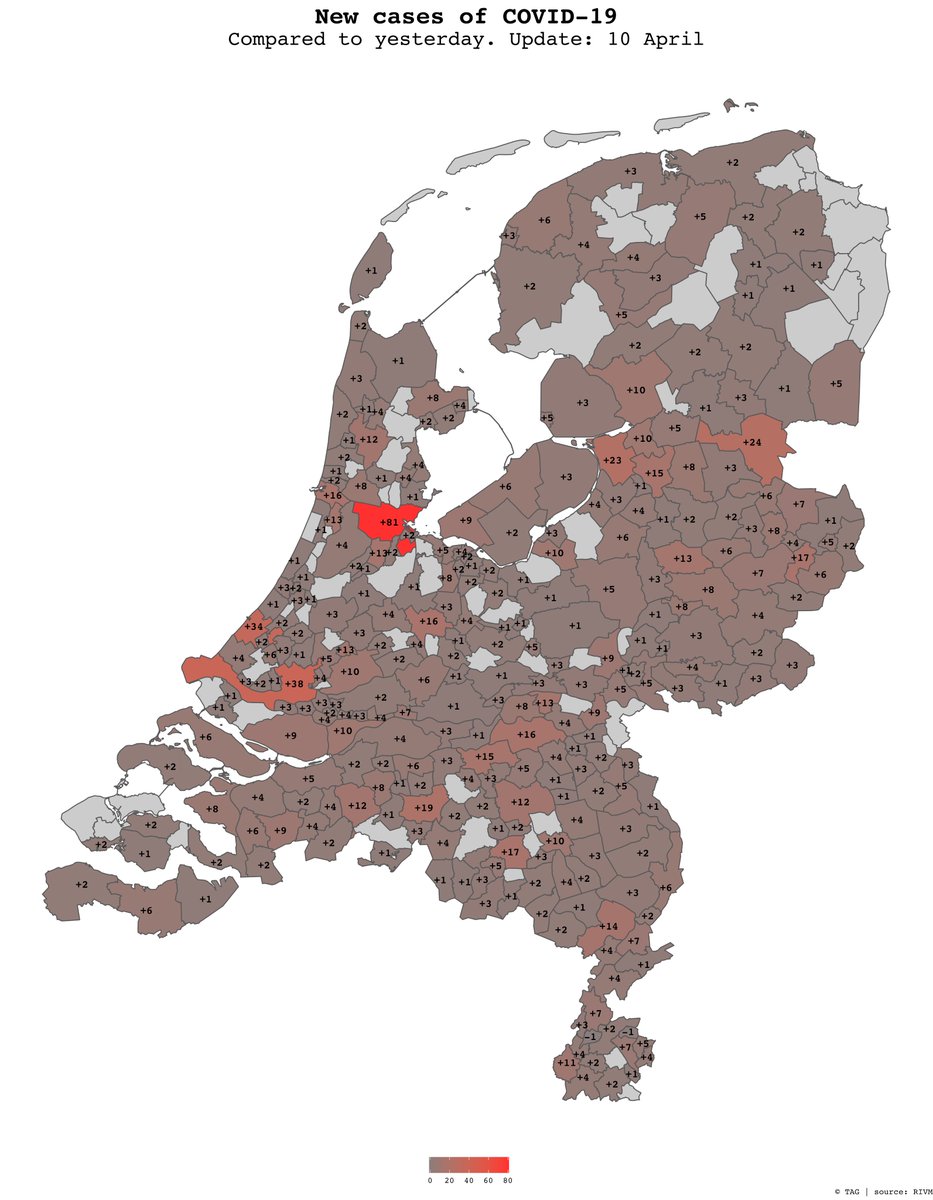
286 municipalities report at least one new cases of #COVIDー19.
Biggest increase in Amsterdam (+81), Rotterdam (+38) and 's-Gravenhage (+34).
#coronanederland #coronakaart #coronavirusNL
Biggest increase in Amsterdam (+81), Rotterdam (+38) and 's-Gravenhage (+34).
#coronanederland #coronakaart #coronavirusNL
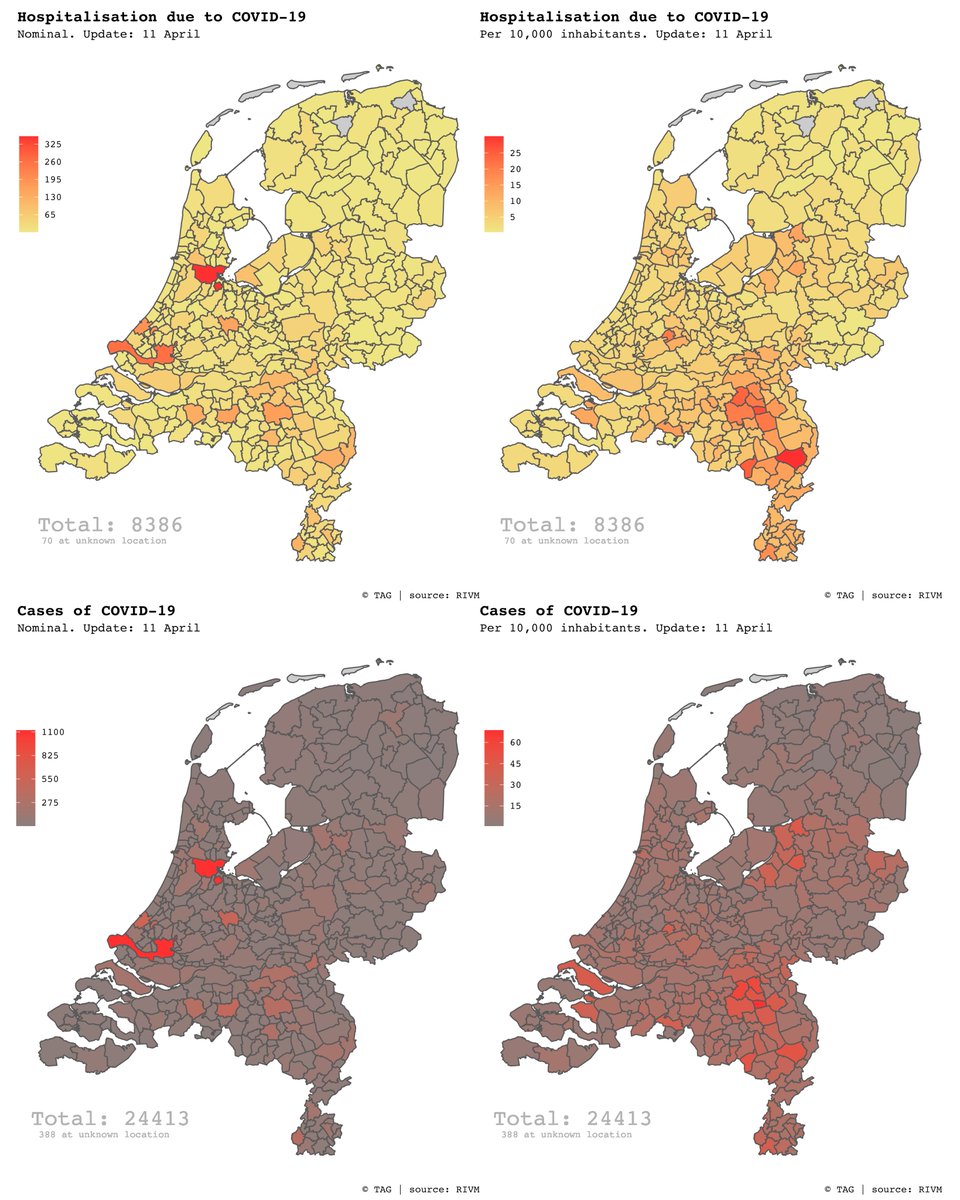
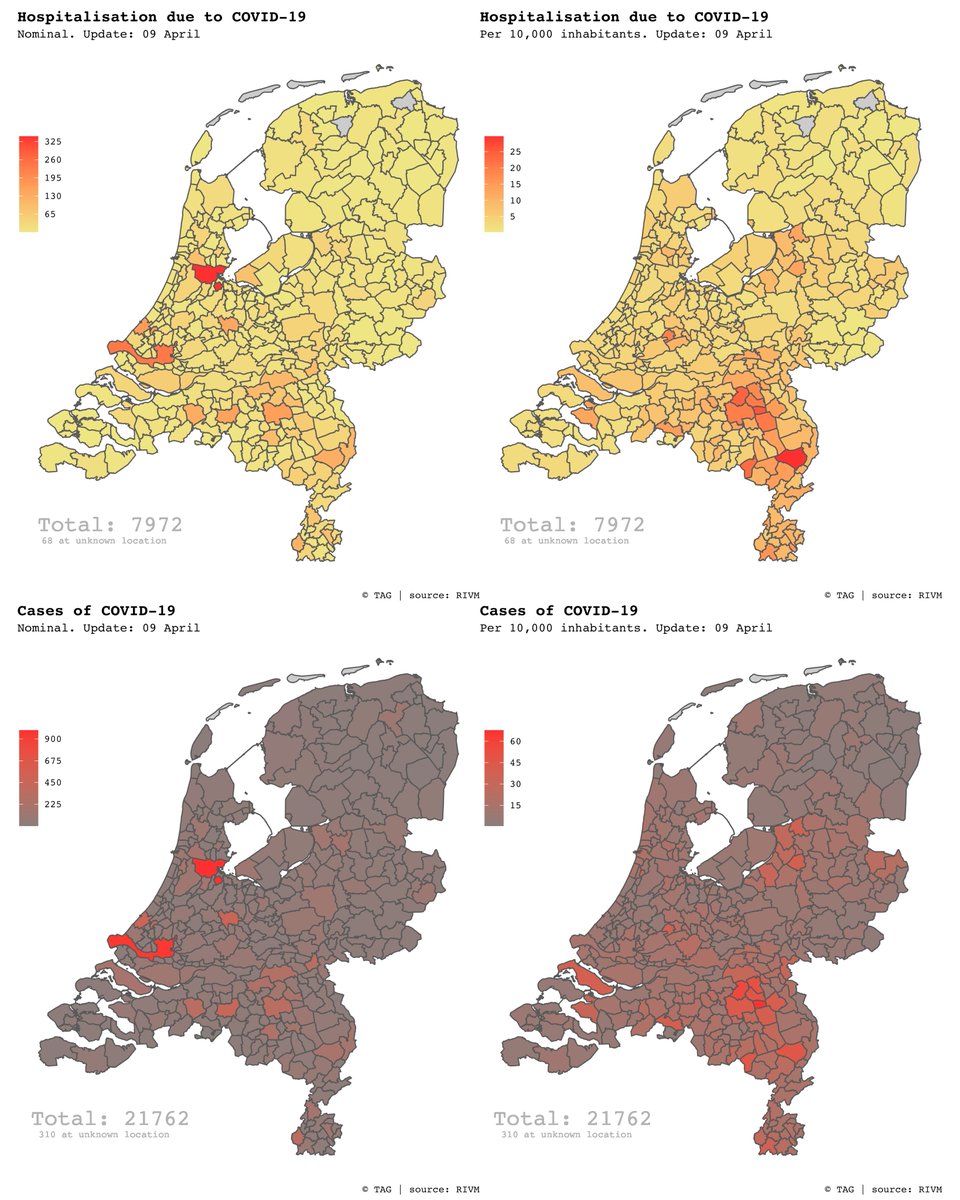
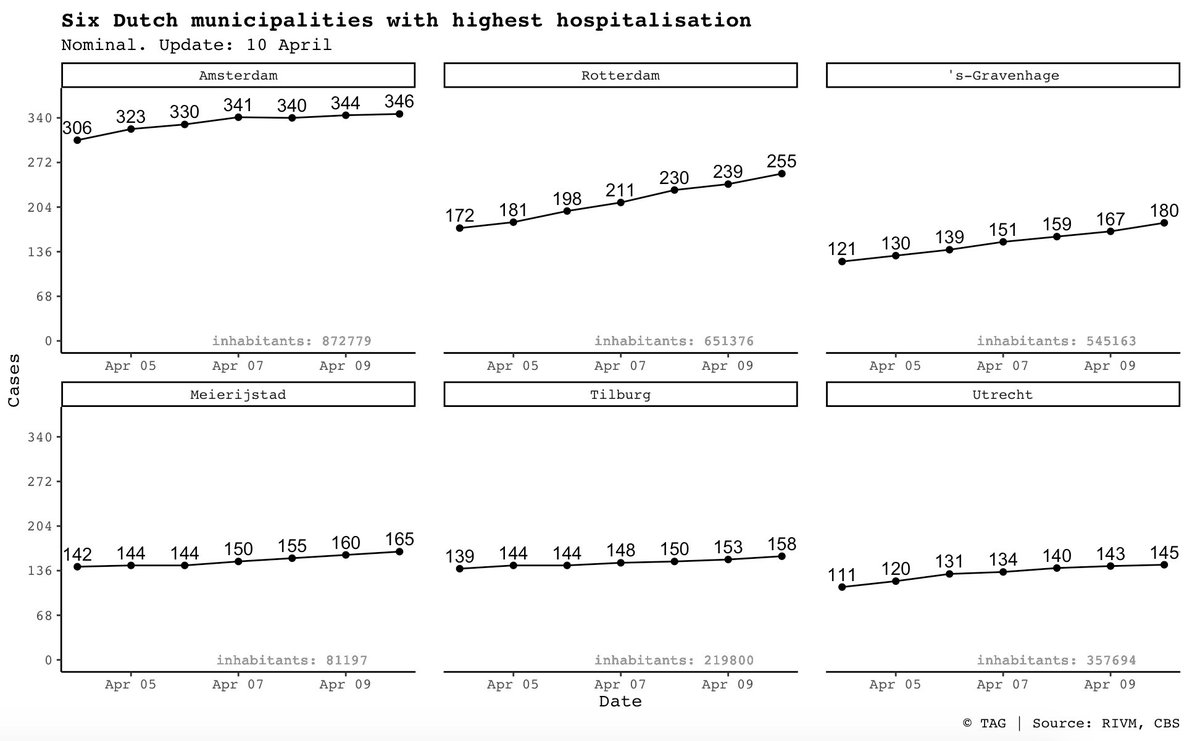
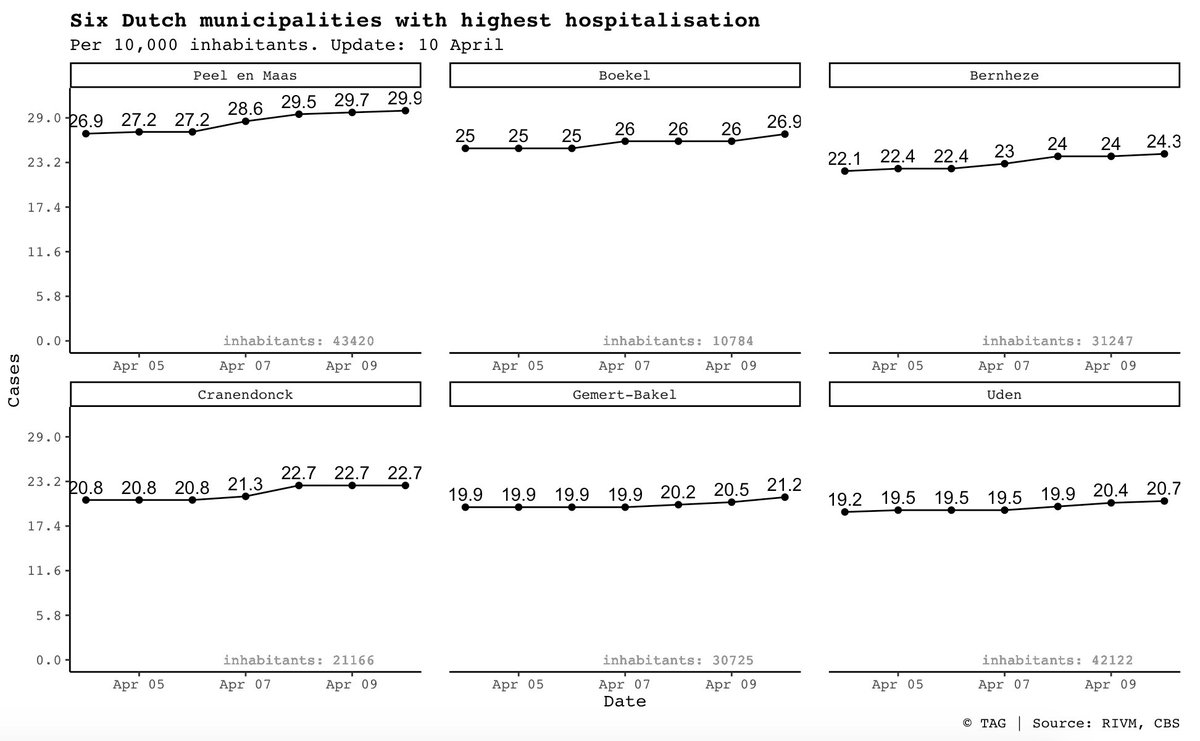
Most hospitalisations: Amsterdam, Rotterdam, 's-Gravenhage, Meierijstad, Tilburg and Utrecht.
Most hospitalisations per 10,000 inhabitants: Peel en Maas, Boekel, Bernheze, Cranendonck, Gemert-Bakel and Uden.
#coronavirusNL #coronavirusNederland
Most hospitalisations per 10,000 inhabitants: Peel en Maas, Boekel, Bernheze, Cranendonck, Gemert-Bakel and Uden.
#coronavirusNL #coronavirusNederland
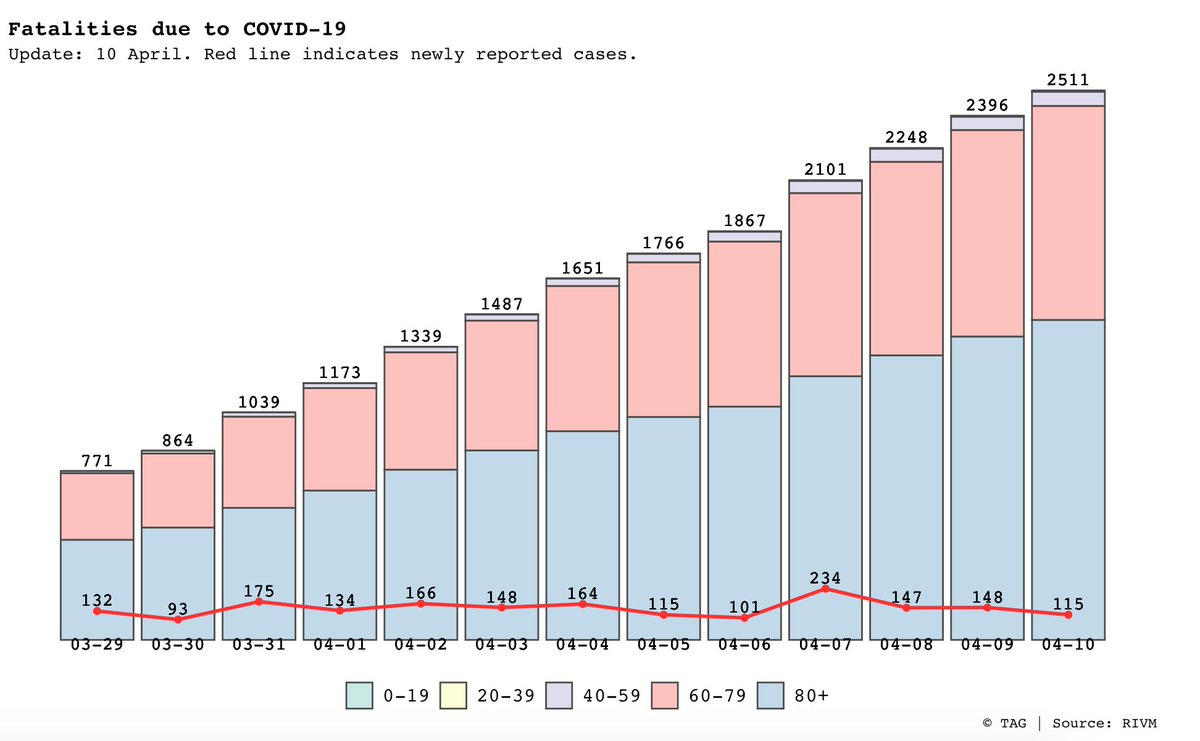
Unfortunately, 115 new fatalities are reported. There might be some delay in these reports. The youngest deceased is between 25 and 29.
Graph shows the fatalities due to #COVID19 in the last couple of days per different age group.
#coronavirusNL #COVID19NL
Graph shows the fatalities due to #COVID19 in the last couple of days per different age group.
#coronavirusNL #COVID19NL
unroll @threadreaderapp