It’s been a week since THAT thread using Critical Care data (from ICNARC) to challenge the narrative that those getting very seriously ill or dying from COVID-19 were already “at death’s door”.
There’s a new report out (and I’m a glutton for punishment) so let’s dive back in. /1
There’s a new report out (and I’m a glutton for punishment) so let’s dive back in. /1
Why go back? Well, we now have twice as many admissions and outcomes as a week ago. That, and this chart👇remind us just how recent the UK epidemic is. More data means we can be more confident with conclusions.
Also, @ICS_updates asked me. Delighted to help in some small way. /2
Also, @ICS_updates asked me. Delighted to help in some small way. /2
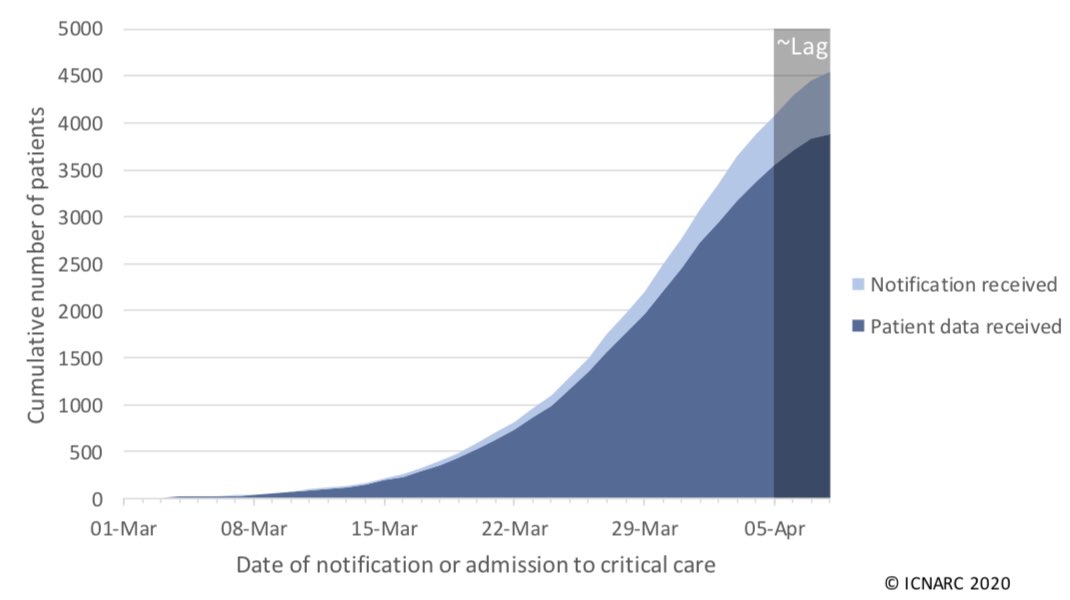
Latest report goes to 9 April and covers 3,883 patients. There are 871 deaths and 818 patients discharged (I don’t know for sure if Boris made the 4pm cutoff to be included). The majority of patients are still receiving critical care. /3
Report here: icnarc.org/DataServices/A…
Report here: icnarc.org/DataServices/A…
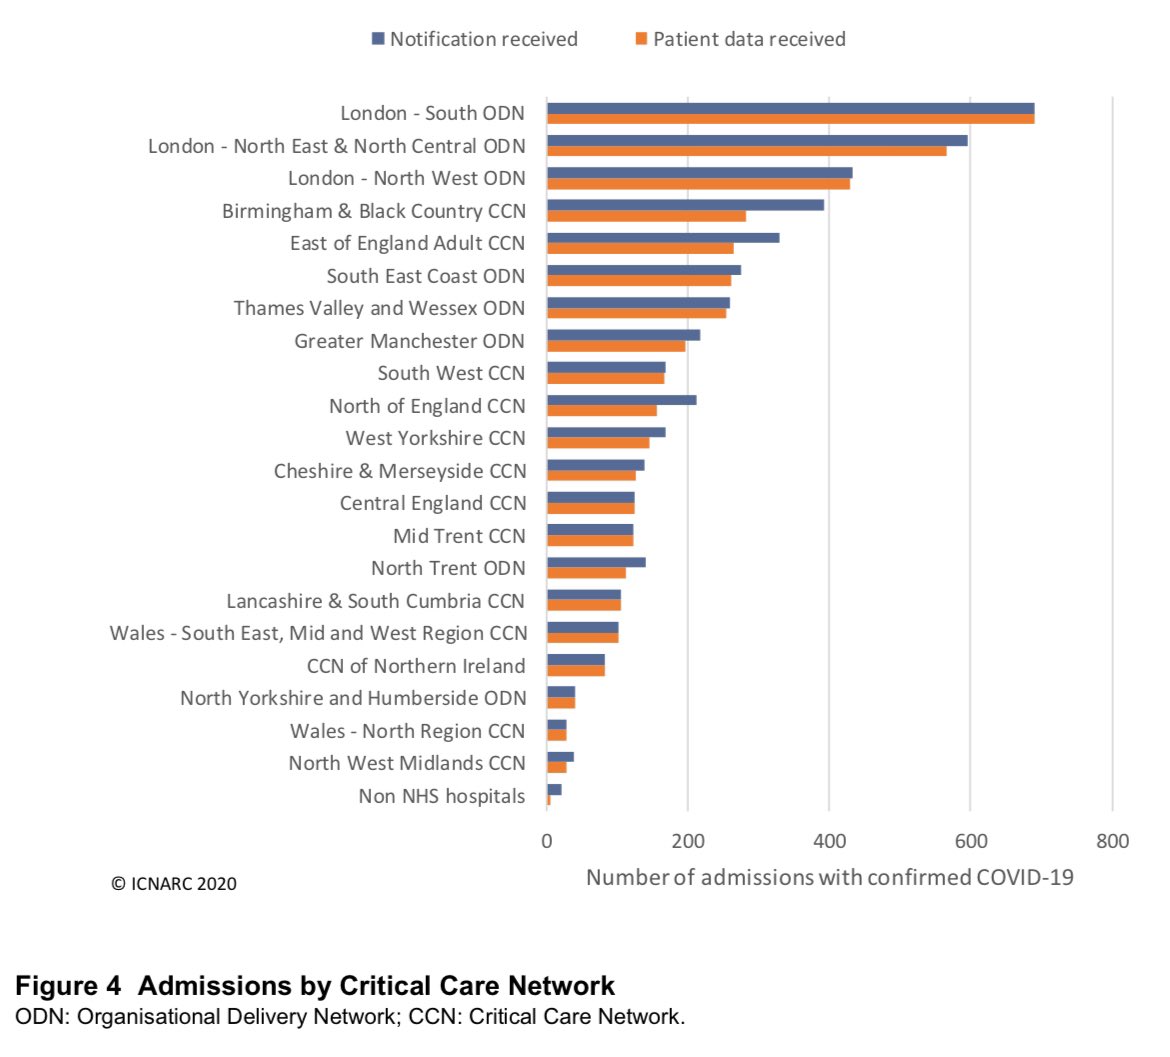
Figure 4 shows how concentrated on London the demand is, for now. The top three networks are all in London so we can add these up when comparing to other parts of England, Wales and NI (Scotland isn’t covered by this report). /4
Here is Table 1 again. With headings this week to make life easier!
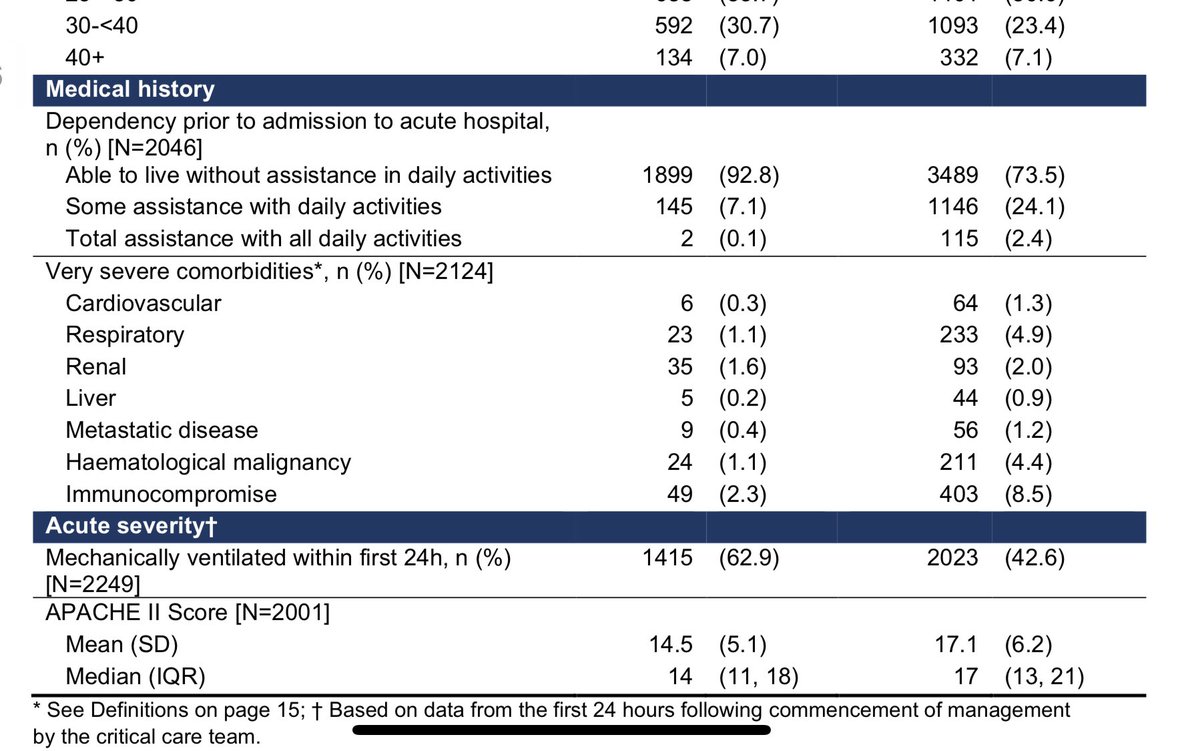
As before, 93% of COVID-19 critical cases were able to live without assistance in daily activities prior to admission. That is MUCH higher than typical viral pneumonia cases (74%). /5
As before, 93% of COVID-19 critical cases were able to live without assistance in daily activities prior to admission. That is MUCH higher than typical viral pneumonia cases (74%). /5
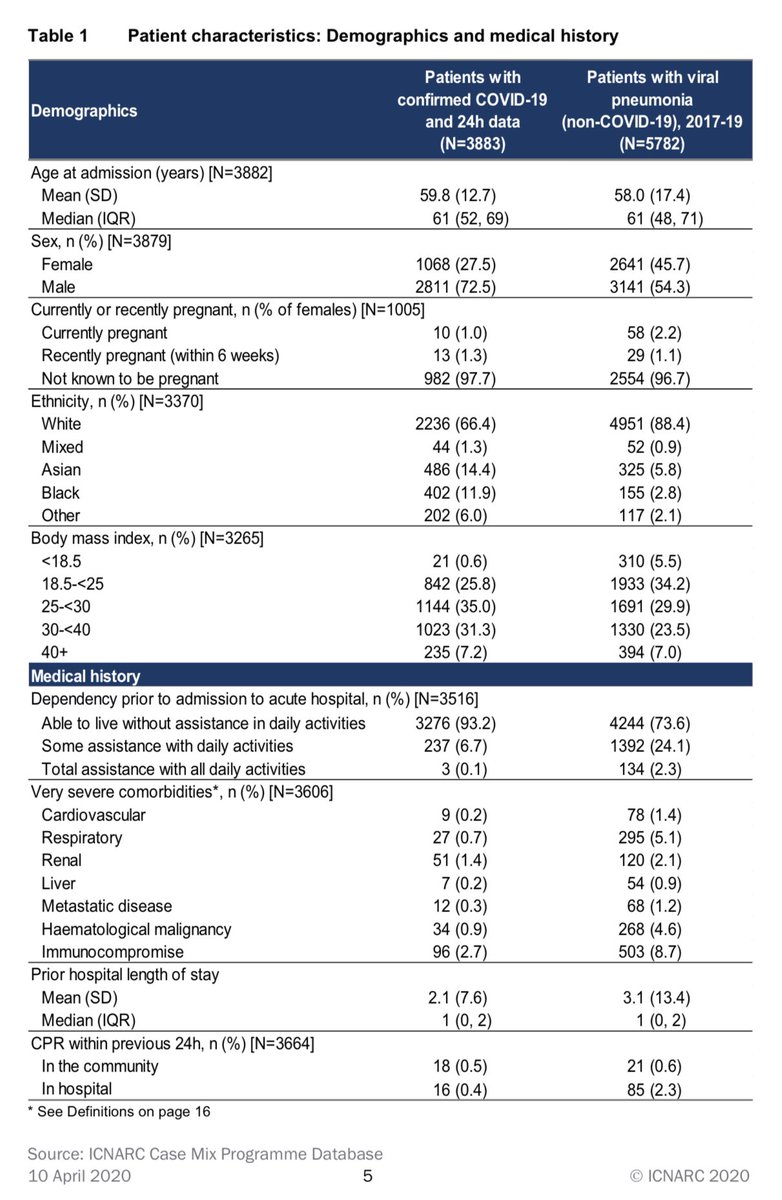
94% were free of very severe comorbidities (Table 1👆). Slightly up on last week. Again, higher than typical viral pneumonia.
As I highlighted previously, these last two points provide good evidence to contest assertions that these patients would have died soon in any case. /6
As I highlighted previously, these last two points provide good evidence to contest assertions that these patients would have died soon in any case. /6
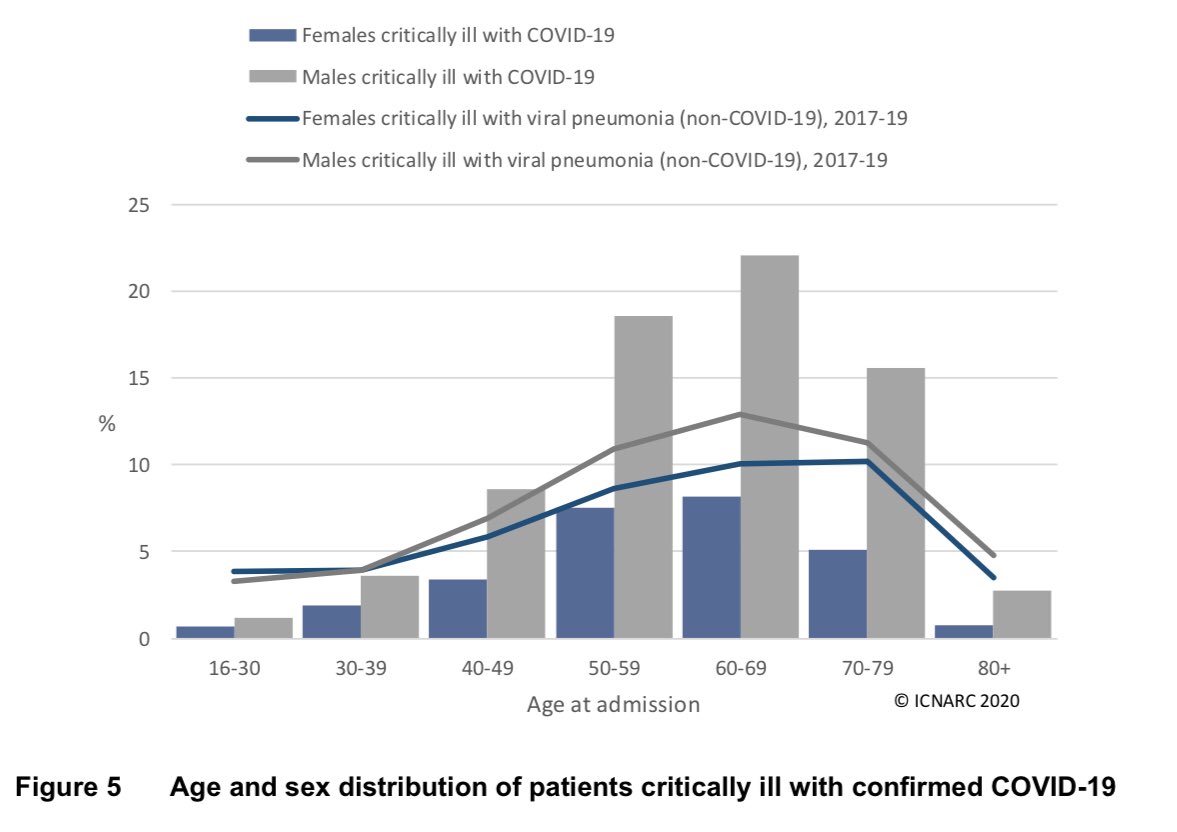
I didn’t mention sex difference last week. I had no idea the thread would reach much beyond existing followers, and I’d highlighted this point already that day. Nearly three quarters are male!
Figure 5 gives the age and sex breakdown. /7
Figure 5 gives the age and sex breakdown. /7
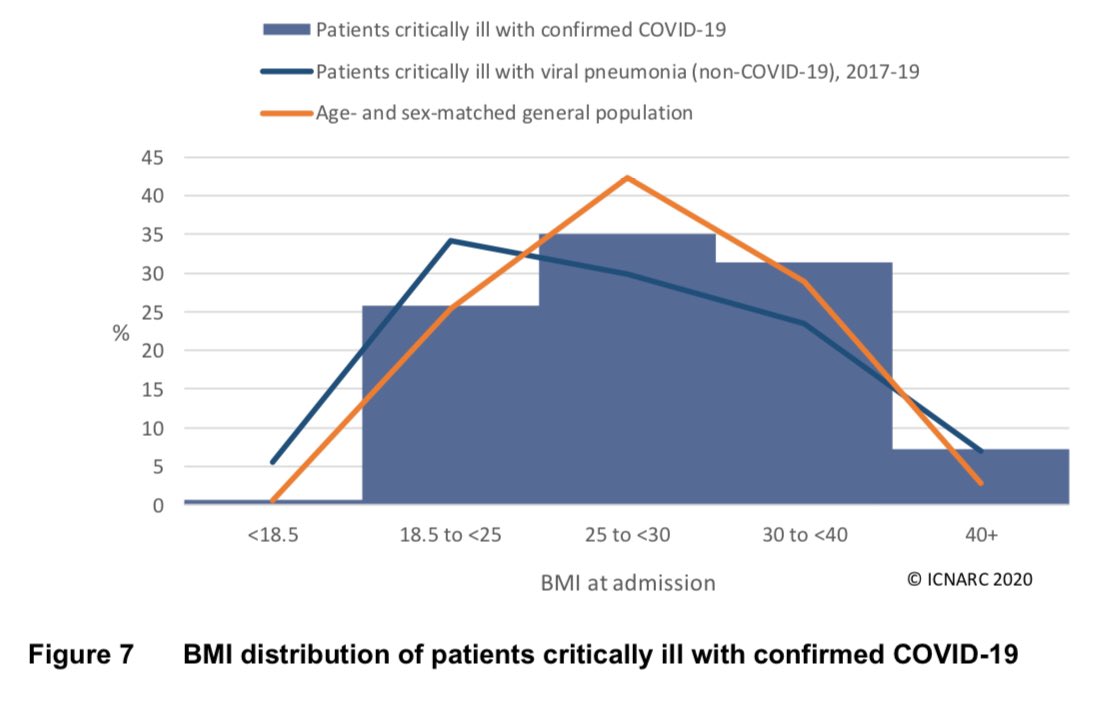
One point that looks interesting at first glance is that only a quarter of ICU admissions have a “healthy” BMI (between 18.5 and 24.9). However, as Figure 7 shows, that’s actually consistent with the general population (once we control for age and sex). /8
One thing I’ve been criticised for is not focussing on outcomes (as if admission to intensive care isn’t serious enough already!) Data volumes are bigger now so let’s take a look.
It’s clear👇that chance of dying in ICU increases with age and is a bit higher for males. /9
It’s clear👇that chance of dying in ICU increases with age and is a bit higher for males. /9
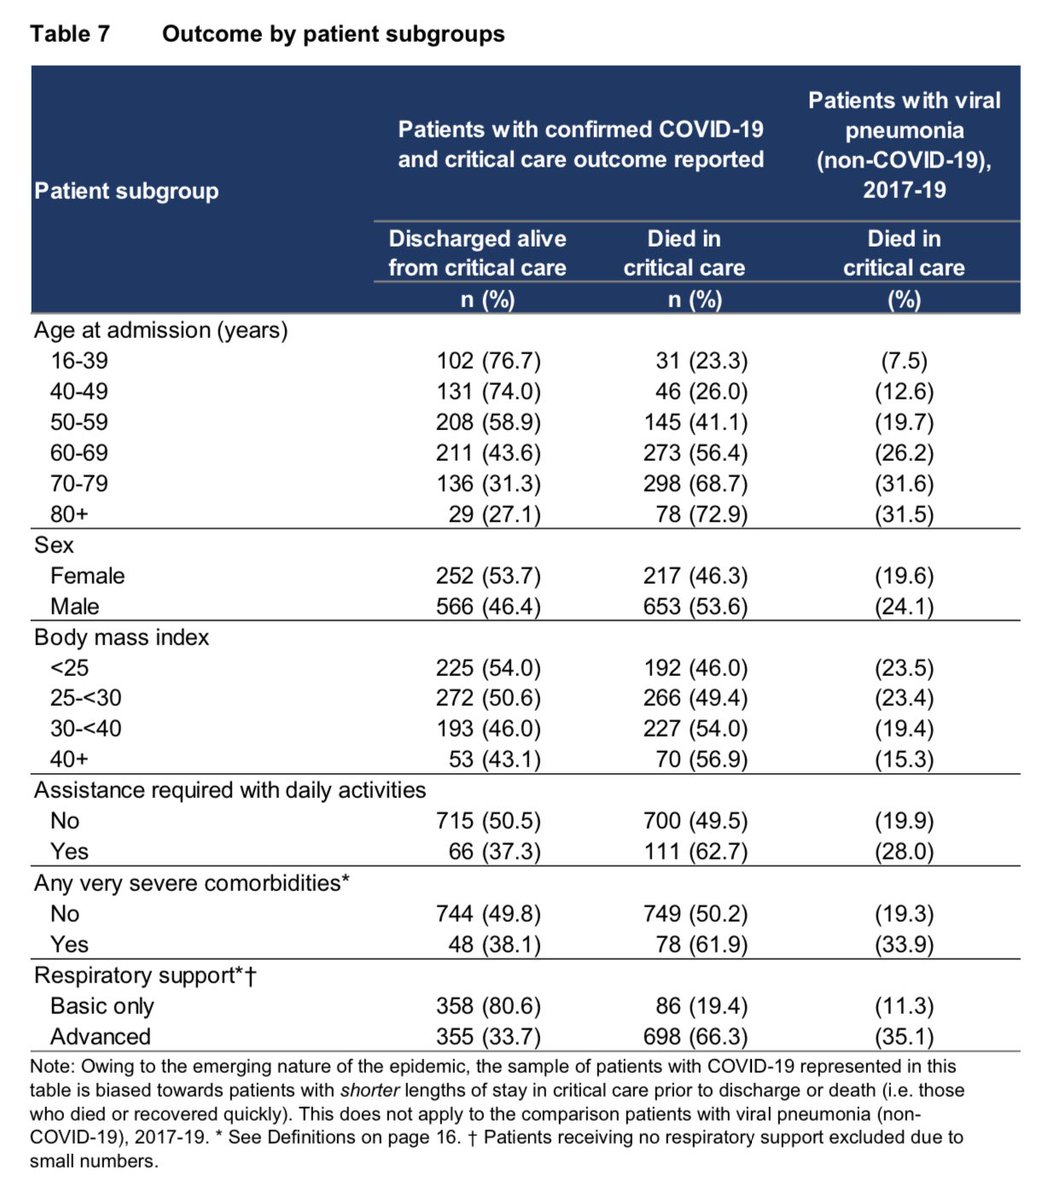
We can also see👆that the chance of dying increases slightly with BMI category and is a bit higher (60% vs 50%) for the small minority needing assistance with daily living and those with very severe comorbidities. These findings certainly don’t undermine my conclusions. /10
The toughest challenge to my thread was in about applying my conclusions from Critical Care patients to the general population. It’s a fair challenge and it’s something I worried about myself and took care to highlight. /11
I have no expertise in ICU admissions criteria and was worried, as a statistician, about sample bias. So, who is expert in ICU admissions? @ICS_updates! Specifically, the intensivist who got in touch saying he agreed with my conclusions. (Phew!) /12
So that’s the update. Still seems clear that a majority of these patients were not seriously ill before COVID-19.
I hope it’s helpful - if so I’ll do these weekly on behalf of @ICS_updates and @COVID19actuary.
If you wish, you can support the intensive care community here. /13
I hope it’s helpful - if so I’ll do these weekly on behalf of @ICS_updates and @COVID19actuary.
If you wish, you can support the intensive care community here. /13
A note on triage. Here‘s the Decision Support Tool which aids clinicians deciding who to admit to ICU. I don’t know how long this has been in effect - I’ve been sent it a few times in last 24hrs but not before that.
If total score is 9 or more the guidance is not to admit. /14
If total score is 9 or more the guidance is not to admit. /14
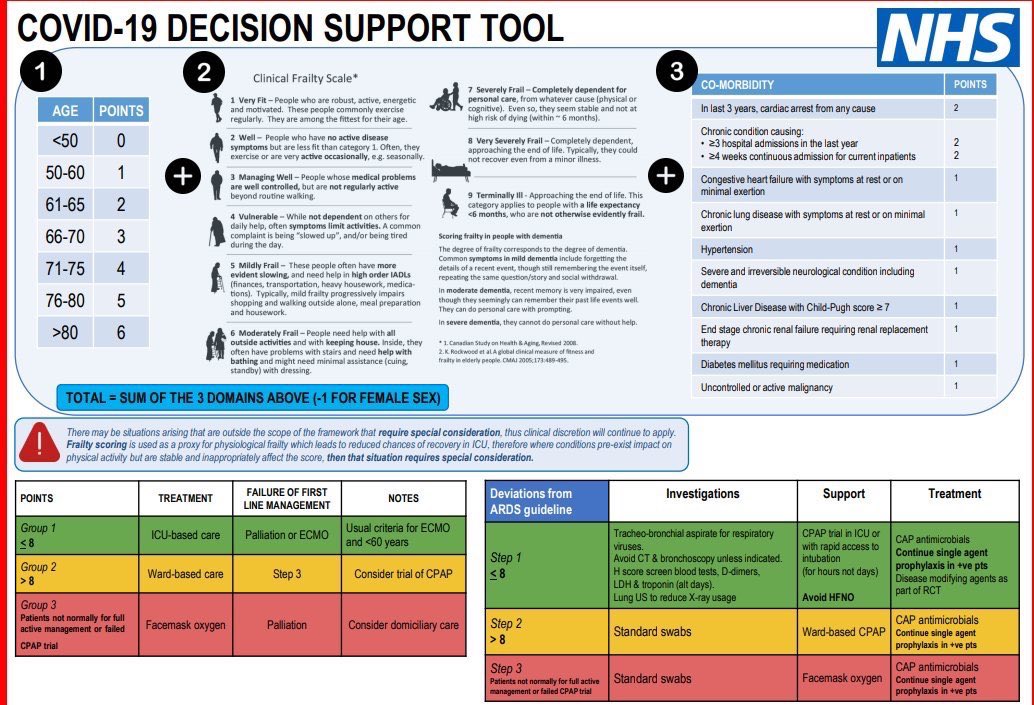
Male 73, “vulnerable”, diabetic (requiring medication):
4 + 4 + 1 = 9 ➡️ ward-based care
Female 79, “managing well”, high blood pressure:
5 + 3 + 1 - 1 = 8 ➡️ ICU-based care
Note that clinical discretion overrides, especially when conditions were stable prior to COVID-19. /15
4 + 4 + 1 = 9 ➡️ ward-based care
Female 79, “managing well”, high blood pressure:
5 + 3 + 1 - 1 = 8 ➡️ ICU-based care
Note that clinical discretion overrides, especially when conditions were stable prior to COVID-19. /15
So as acknowledged above, some patients who were already very unwell pre-COVID-19 don’t make it to ICU. This will skew ICU data younger with fewer severe conditions than other wards. /16
Judge for yourself whether this level of triage undermines the analysis. I believe it’s still very useful, within caveats above. Even those scoring above ICU threshold will often have had years left to live (7/9 on the frailty scale still means more than 6 months to live). /17