Use of care and mortality due to corona in Finland, Sweden, Norway, Denmark, Iceland and Estonia; data from yesterday 13.4. New: regional data for Finland.
Read the thread. (English)
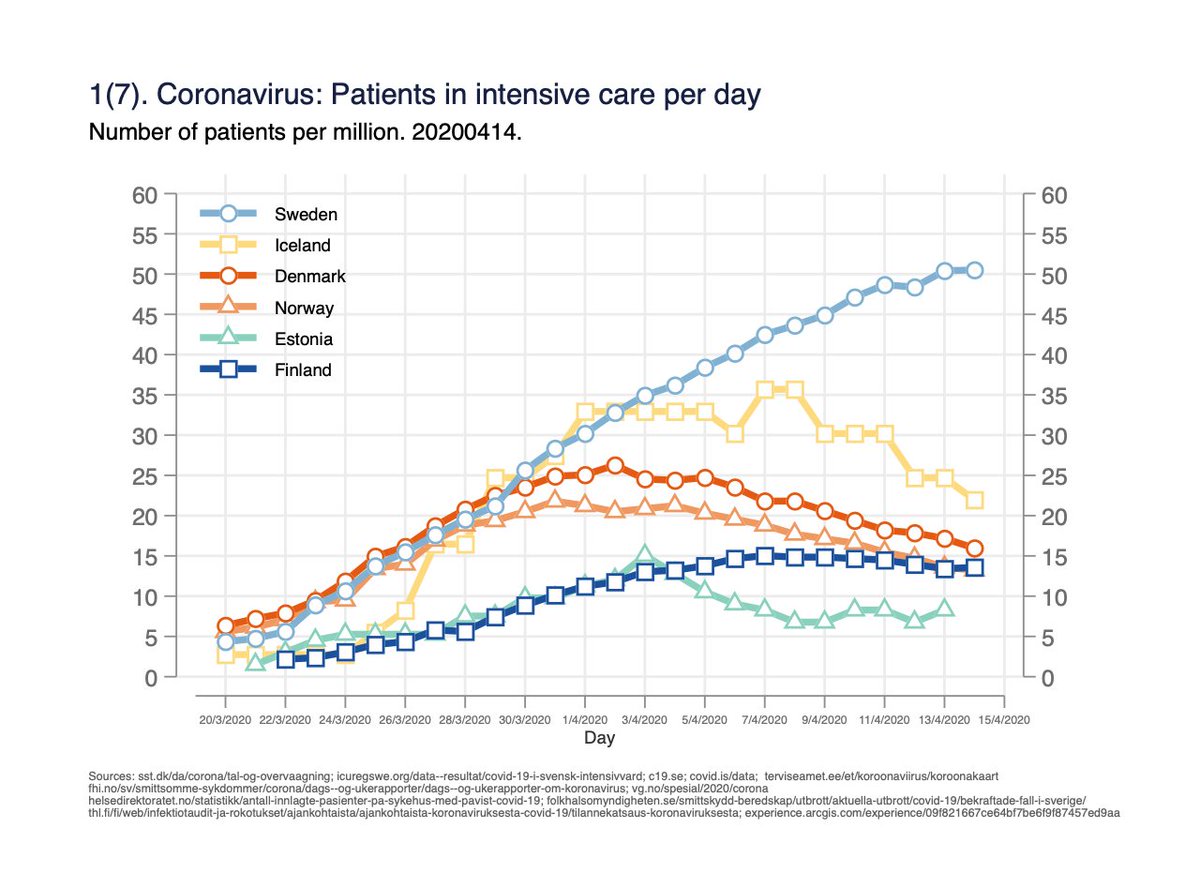
Fig 1. Persons in intensive care per day. Measures the burden on intensive care capacity. 1/x
Read the thread. (English)
Fig 1. Persons in intensive care per day. Measures the burden on intensive care capacity. 1/x

Fig 2. Number of persons in hospital care per day. One person can be counted for several days. Measures the burden on hospital capacity. 2/x

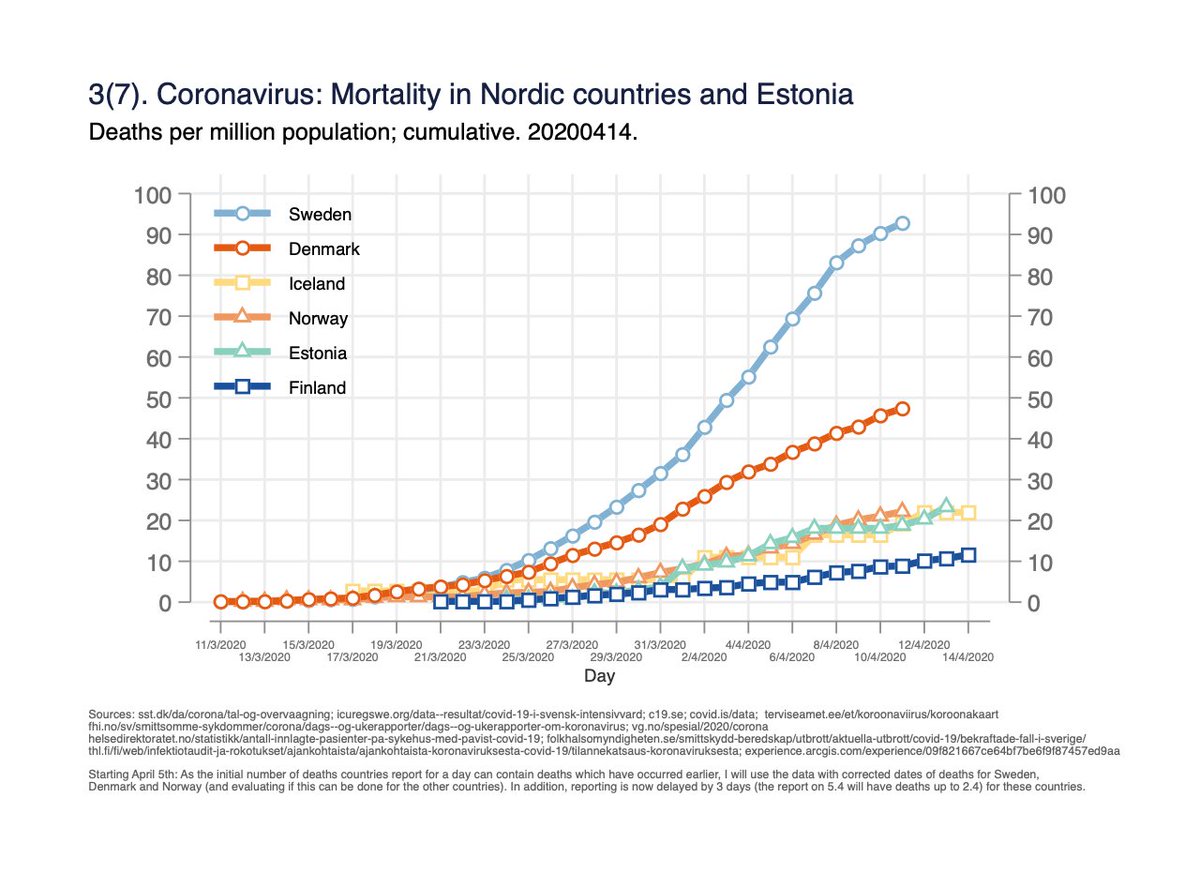
Fig 3. Mortality per million population. 3/x

Fig 4. Mortality per million population on log-scale, by days since 2/million deaths in the country. Same data as fig 3, but y-axis helps to understand rate of change, and time-scale unified. 4/x

Fig 5. Absolute number of deaths by days since 10th death in the country.
(Attempts to get same starting point/phase of the epidemic for all countries). 5/x
(Attempts to get same starting point/phase of the epidemic for all countries). 5/x

The following are geographical differences within Finland; might be of interest to other countries to understand the spread&trend between the capital area (Helsinki) vs rest.
Fig 6. Nr of persons in intensive care/day by the five “specialised medical care regions” (“erva”): 6/x
Fig 6. Nr of persons in intensive care/day by the five “specialised medical care regions” (“erva”): 6/x

Fig 7. Number of persons in hospital care per day by the five “specialised medical care regions” (“erva”): 7/x

Helsinki area more affected early on; traveling to/from the region limited since 28.3. I expected to see decline in use of care first in Helsinki, but it seems to be the other way around (at second thought quite reasonably so: stopped the spread from Helsinki to other parts). 8/x
Nordic comparison in the use of hospital care (fig 1-2); most if not all countries now stabilising or already declining. Also Sweden, nr of *new patients/day* been stable couple of days (not shown). (The data for the latest days is not final, eastern may affect.) 9/x
Note also that the data here, hospital care and mortality, are rather objective but at the same time “late” measures. What we see in these graphs reflects population level changes maybe 2-3 weeks ago. I read the stabilisation in use of care rather positive. 10/x
There could be many explanations for country differences: definition of corona deaths; how the disease started to spread in populations (undetected cases); case-mix; distributions of demographics/comorbidities. Interpret with care! 11/x
The Finnish regional data Fig 6-7: The five “specialised medical care regions” are linked to the five university hospitals in Finland. They correspond to Swedens “sjukvårdsregion”. More info (in swedish): 12/12
kommunforbundet.fi/social-och-hal…
kommunforbundet.fi/social-och-hal…