Epidemiologi, tilastotieteilijä, tutkimusprofessori, kansanterveys. THL/KI. Twiitit yksityishenkilönä. / Epidemiologist, statistician, professor, public health.
 The expectation is these will *decline* over time, as lifestyle, treatments etc improves and life-expectancy increases. These are major changes to the worse in short time. 2/6
 Patients in hospital care due to Covid-19 in the Nordics and the Baltics. 2/4


 The underlying data for the previous 7-day moving average picture, to illustrate the day-to-day variation in reporting. (Sweden excluded.) 2/4
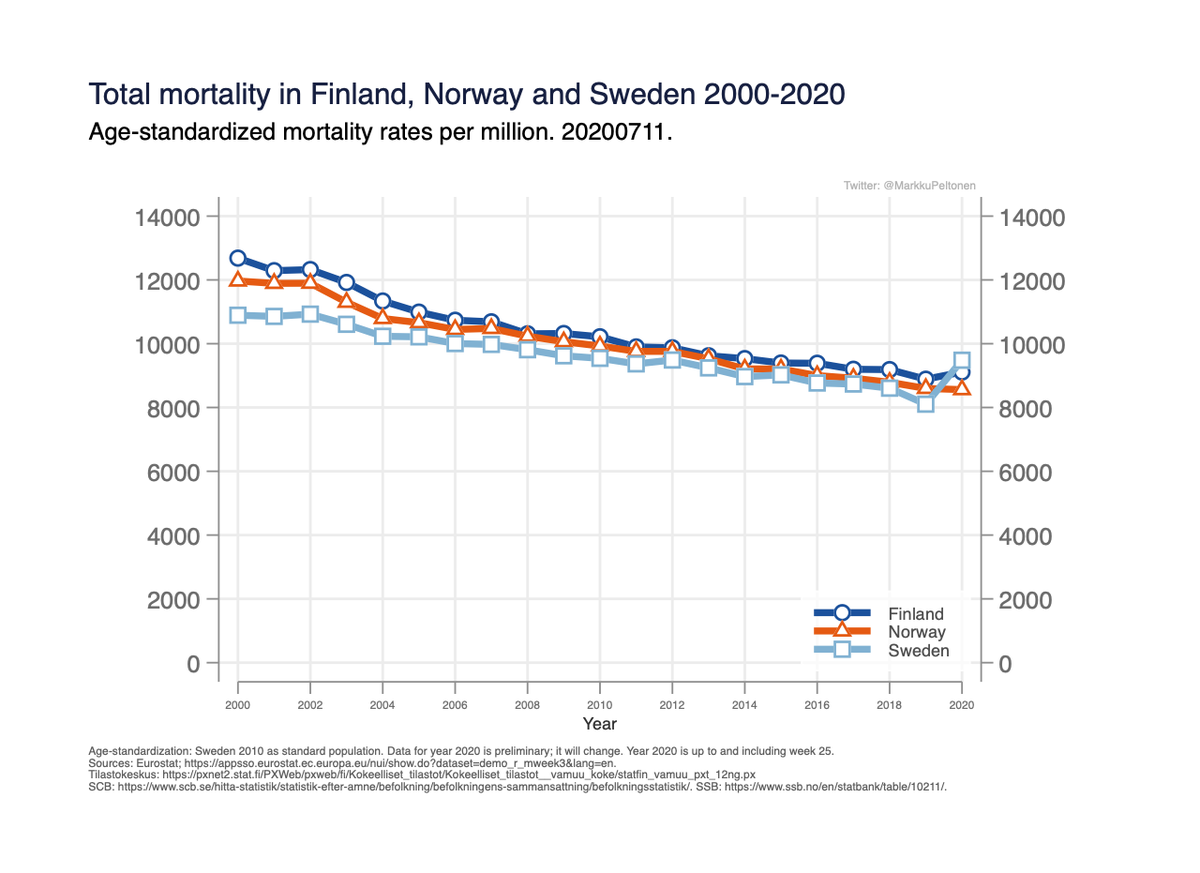 Adjusting for age differences and population sizes, total mortality rates declined in all countries. Highest rates Finland but the gap narrowed over time; Sweden lowest (reflecting highest life-expectancy) + declining.
 In Iceland and Finland no-one in intensive care at the moment, also Norway and Estonia only very few. Good to see the numbers in Sweden declining very rapidly. Also the number of *new* persons declining throughout Sweden: 2/x
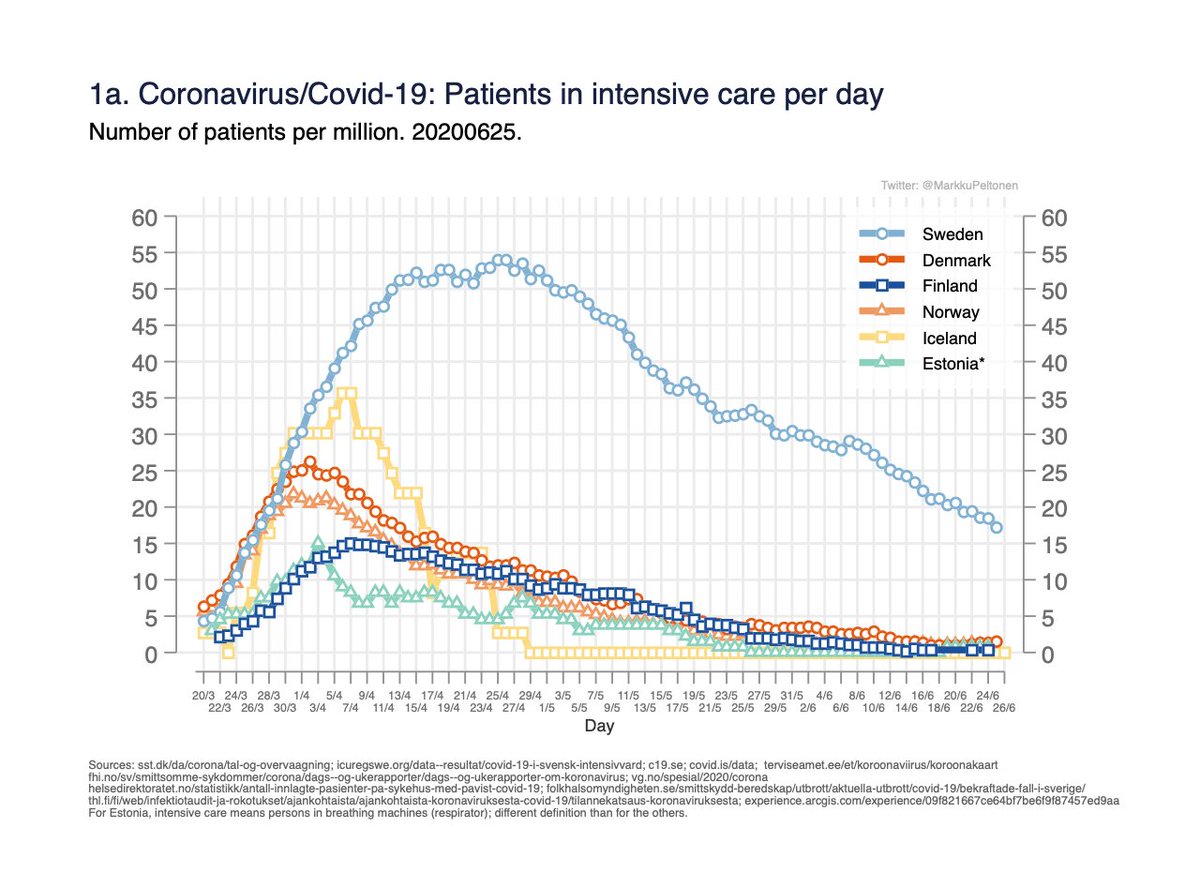
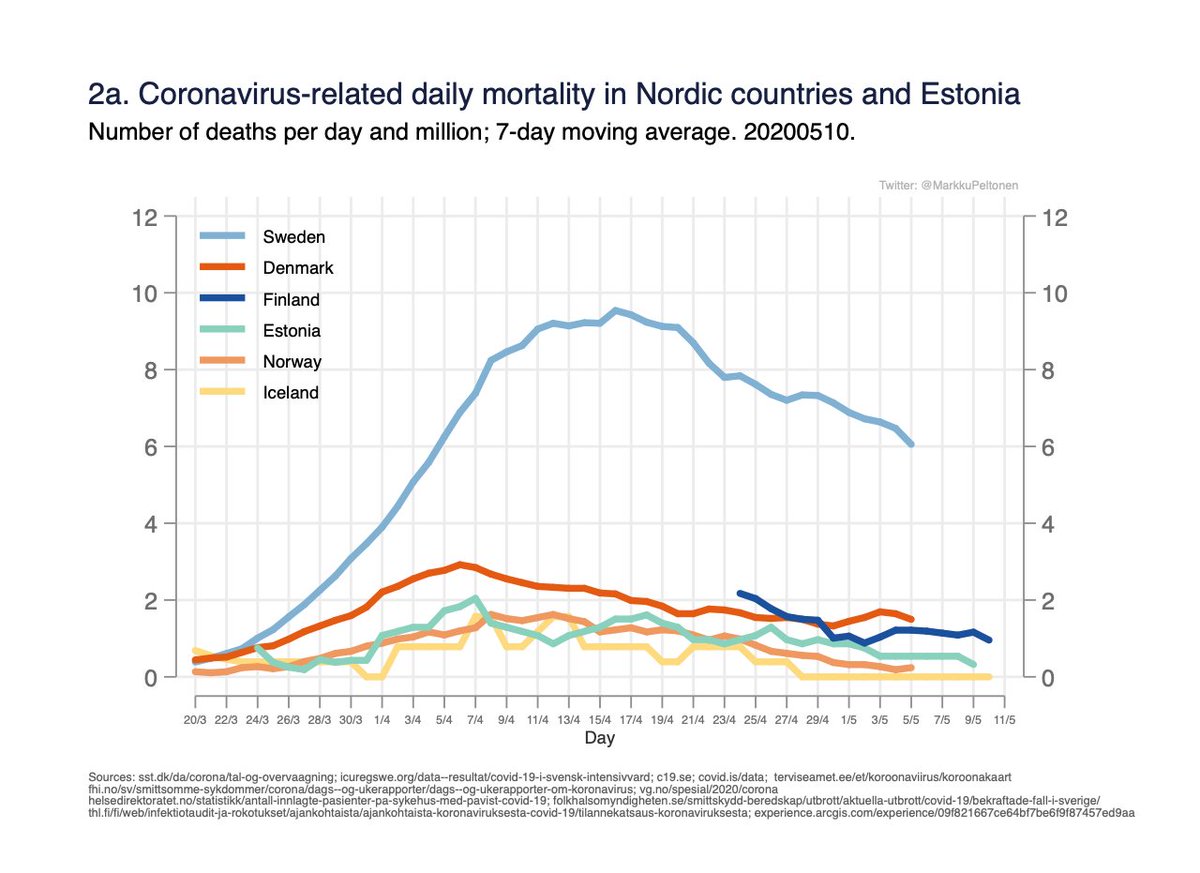
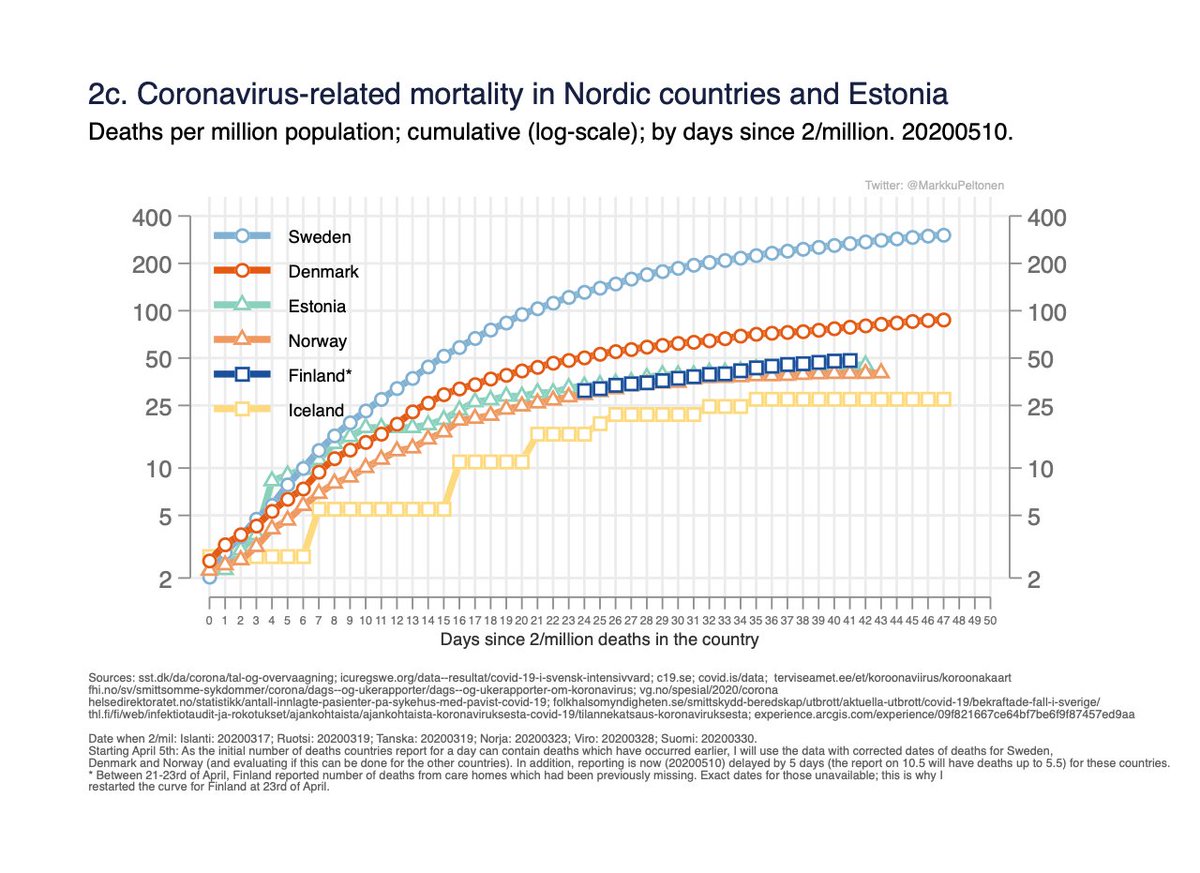
 Fig 2a-c. Number of deaths per day (moving average) and cumulative mortality. 2/x


 Fig 2a-c. Number of deaths per day (moving average) and cumulative mortality. 2/x
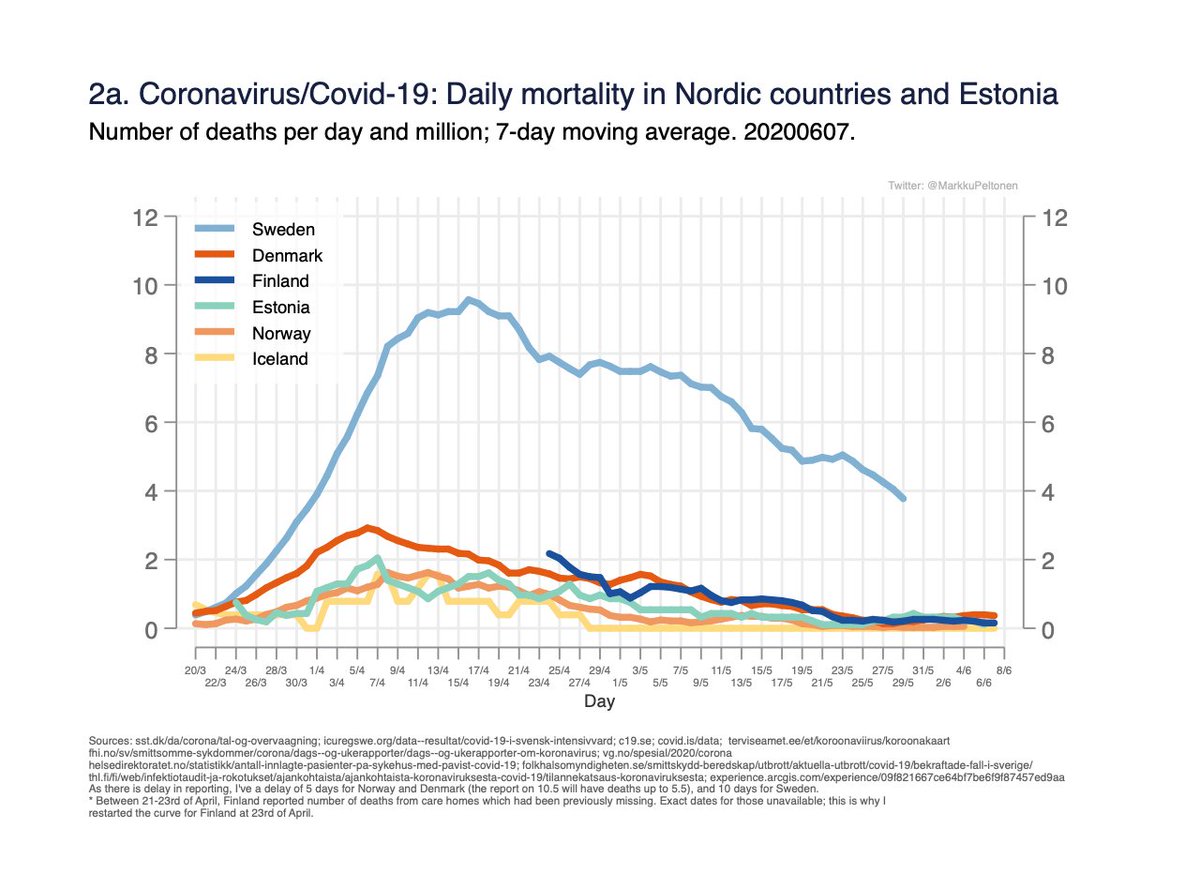


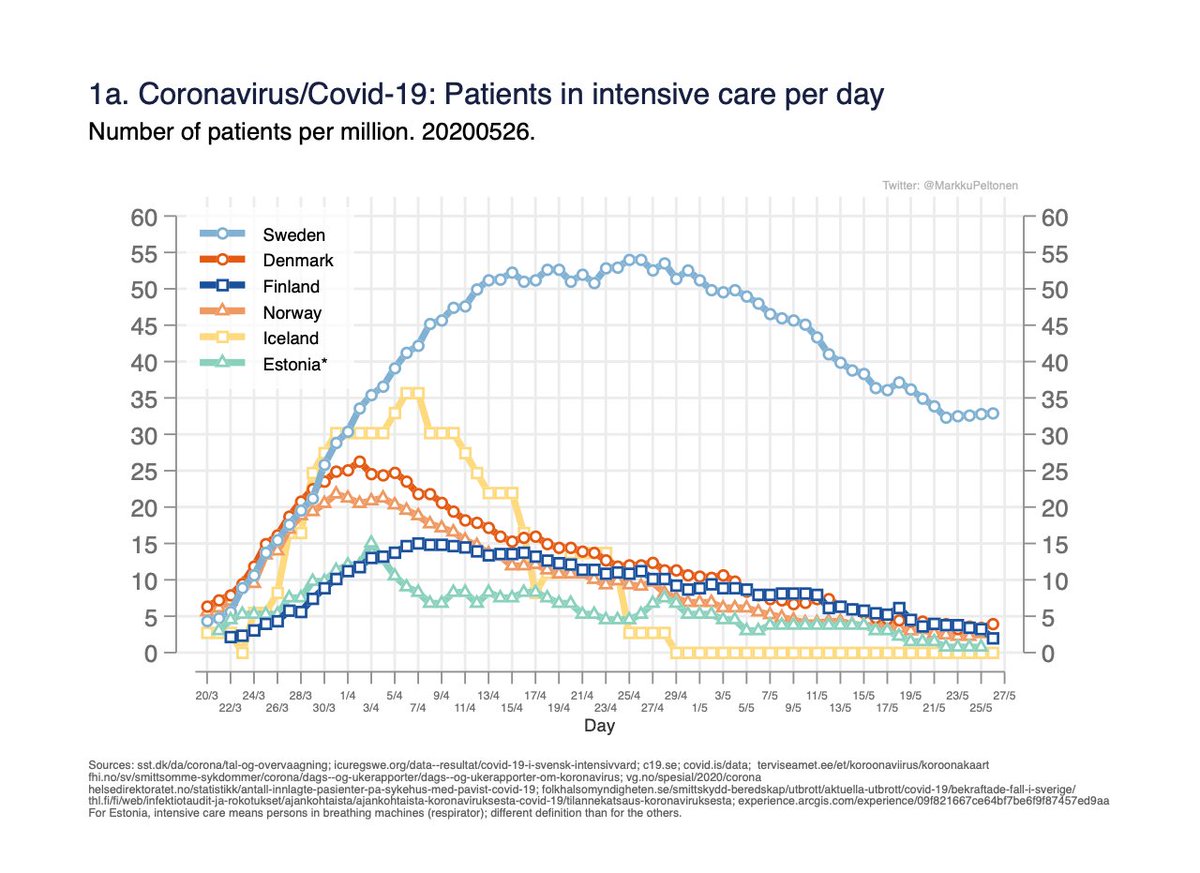
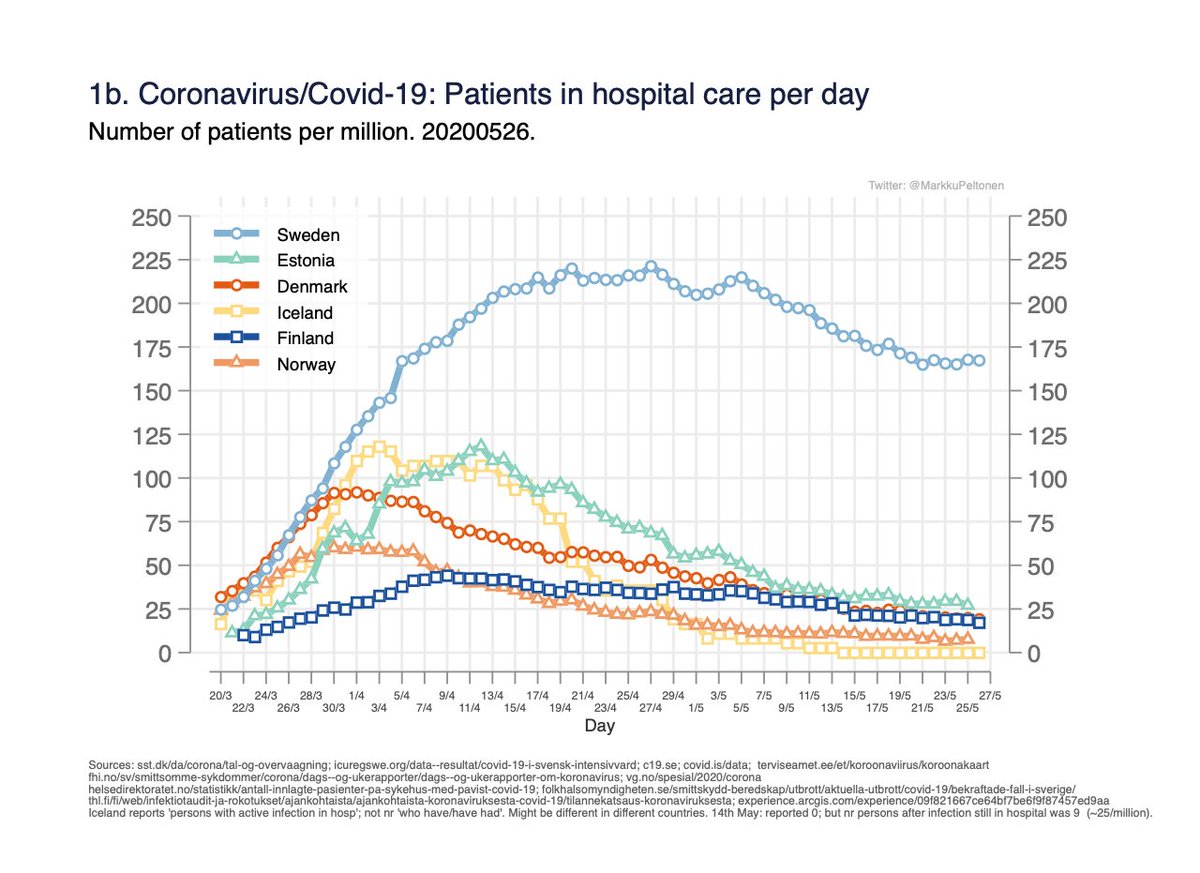 Fig 2a-c. Number of deaths per day (moving average) and cumulative mortality. 2/x


 Fig 2a-c. Number of deaths per day (moving average) and cumulative mortality. 2/x


 Fig 2a-c. Number of deaths per day (moving average) and cumulative mortality. 2/x


 Kuvat 2a-c. Kuolleiden lukumäärät päivittäin ja kumul. suhteutettuna väestöön (linear+log-skaala).


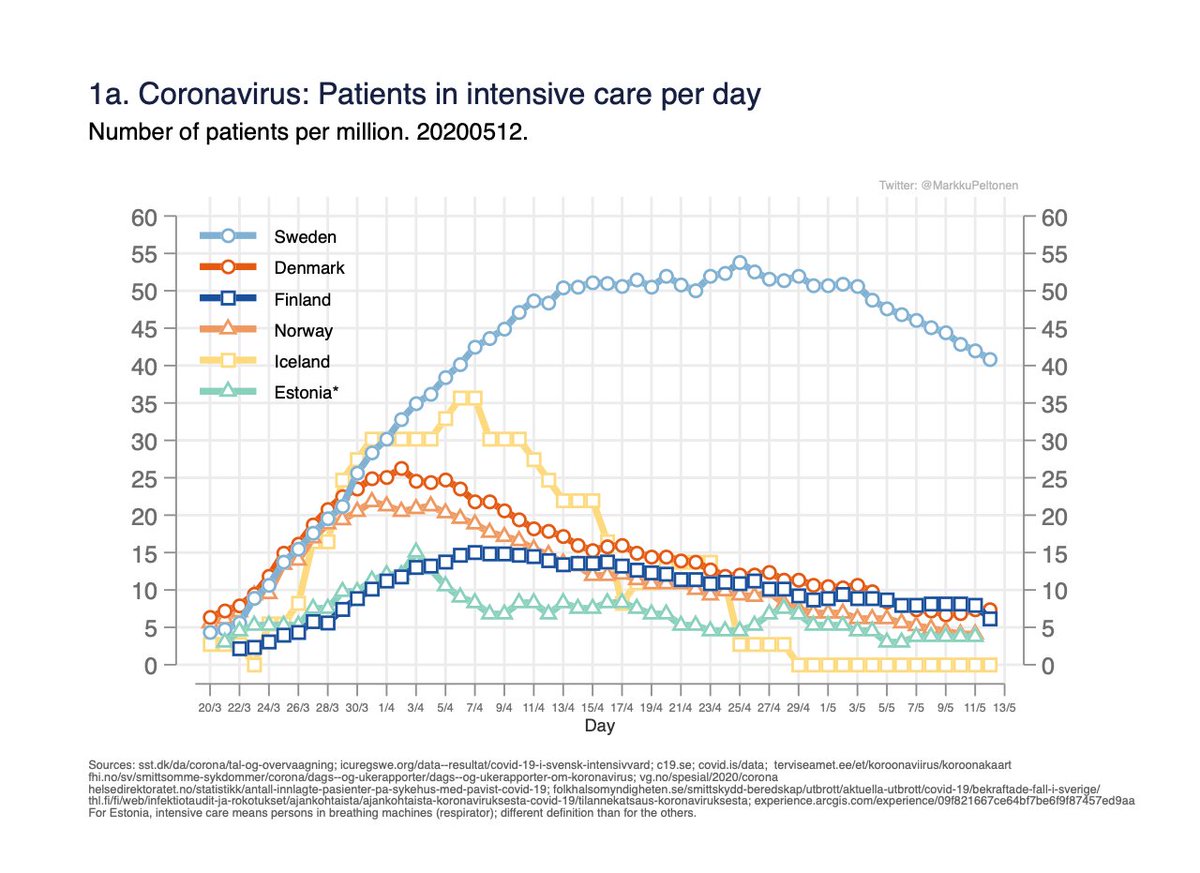
 Fig 2a-c. Number of deaths per day (moving average) and cumulative mortality. 2/x
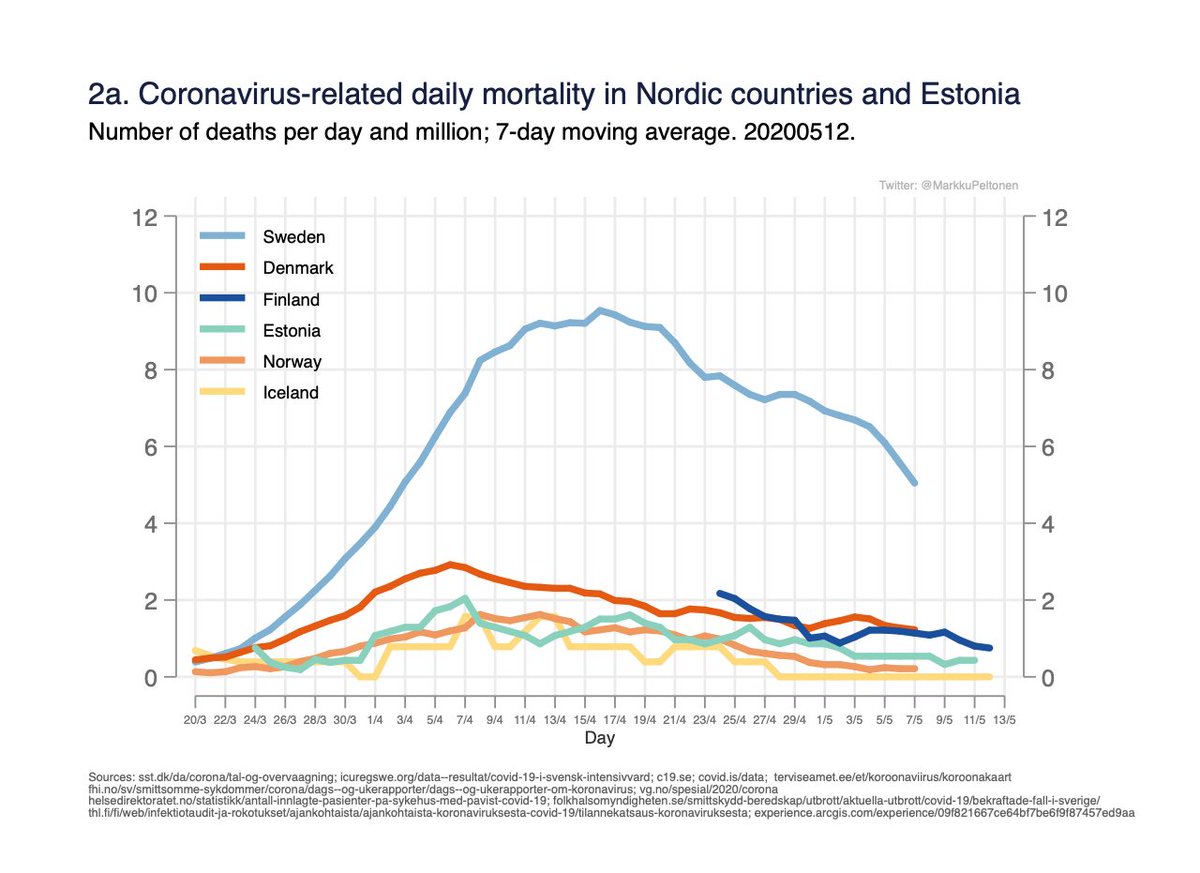
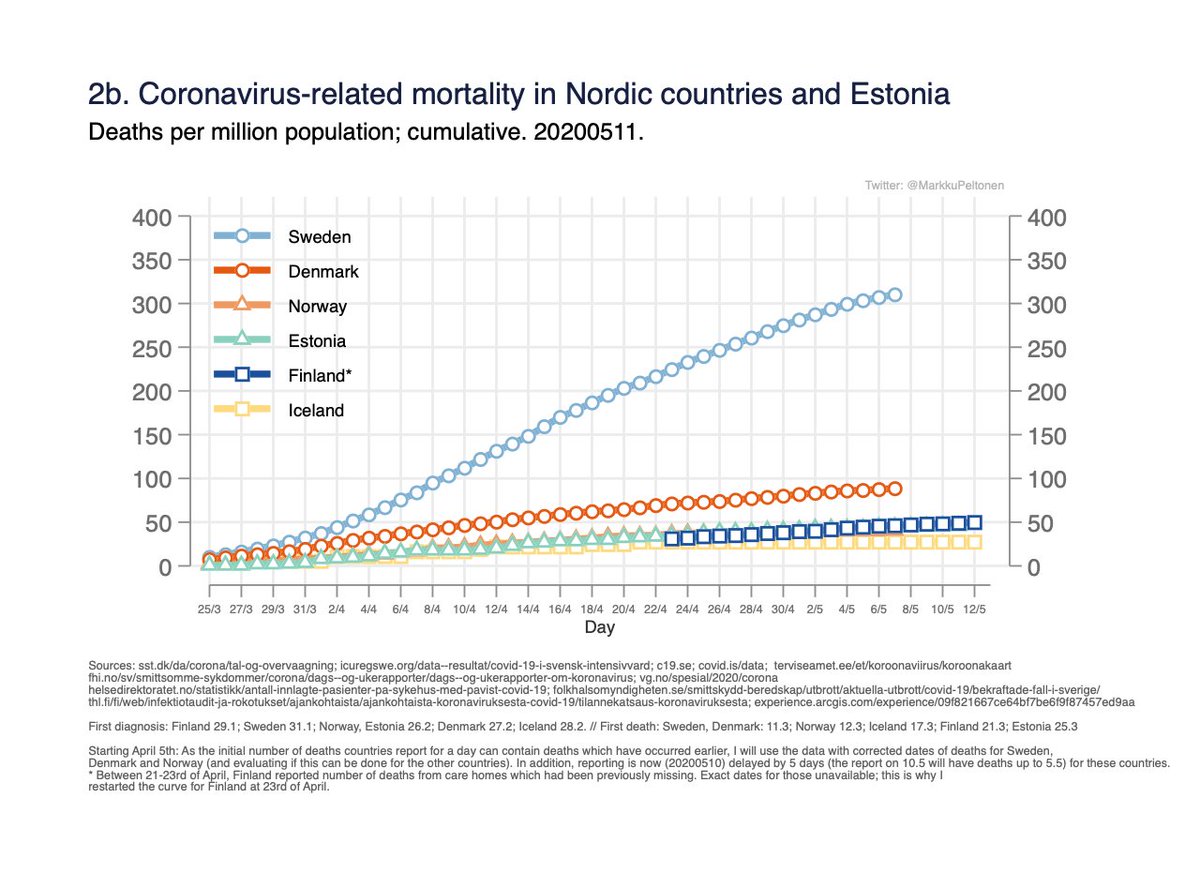


 Kuvat 2a-c. Kuolleiden lukumäärät päivittäin ja kum suhteutettuna väestöön (linear+log-skaala). Päivittäin on 7-päivän liukuva keskiarvo (jokaiselle päivälle kuvassa on sen päivän ja sitä edeltävän 6 päivän keskiarvo. Näin saadaan pois hajontaa, ja trendi selkeytyy). 2/x
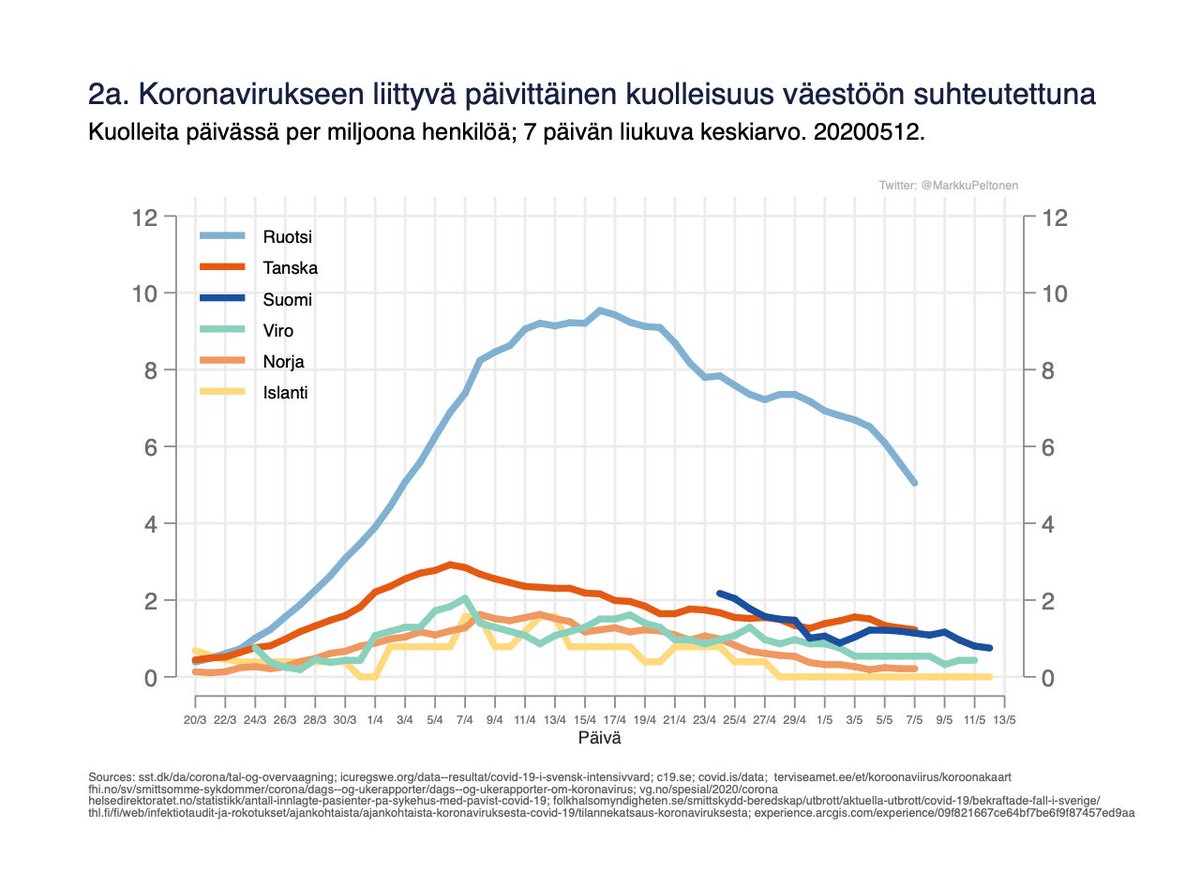


 Fig 2a-c. Number of deaths per day (moving average) and cumulative mortality. 2/x