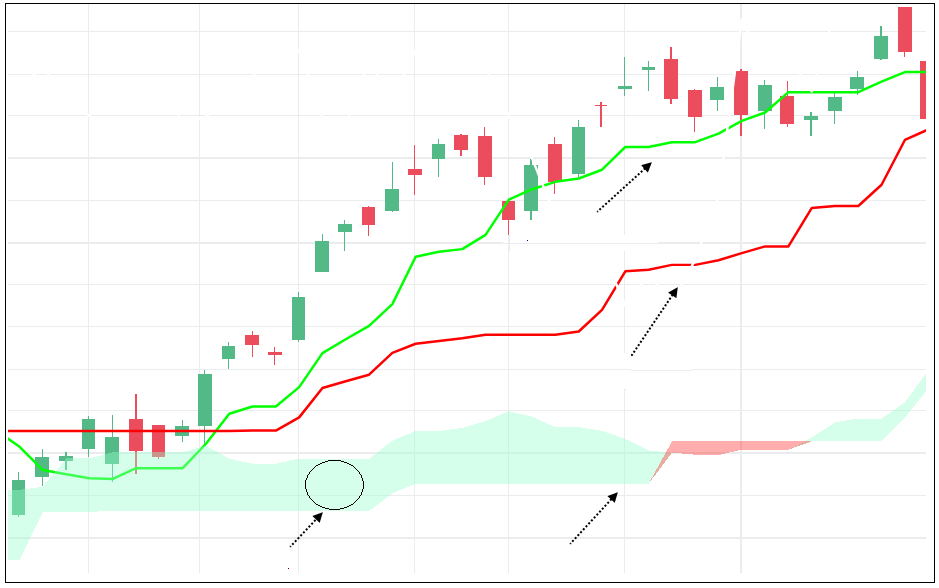
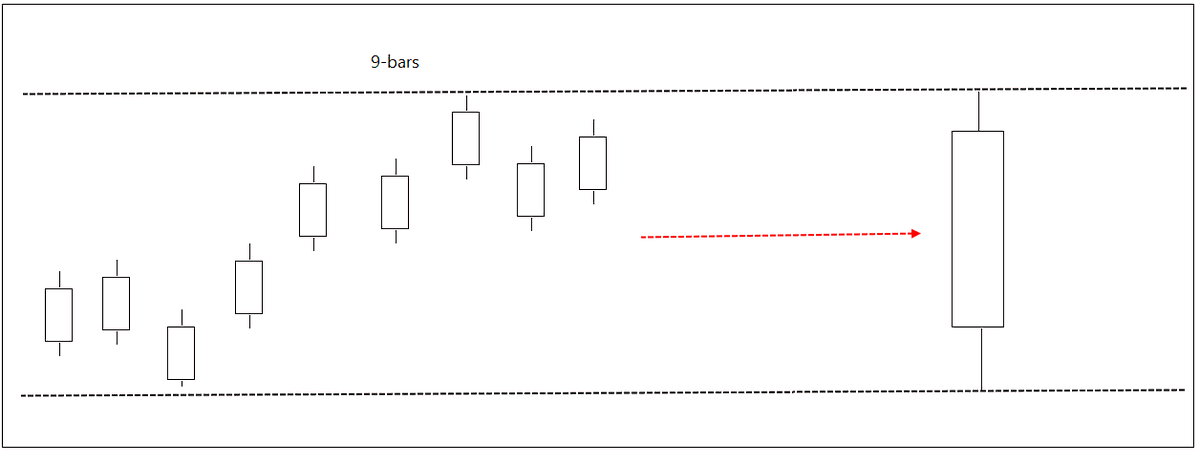
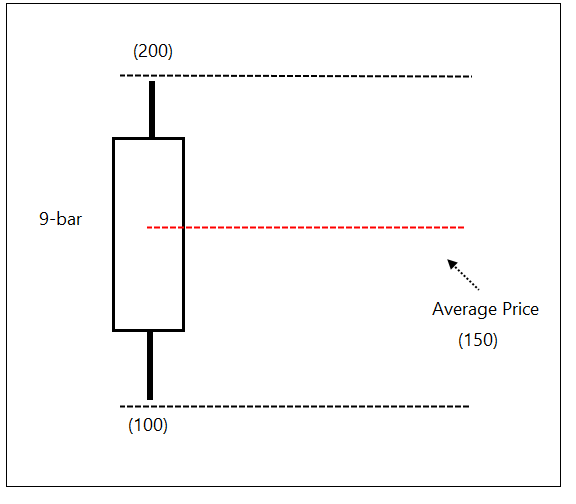
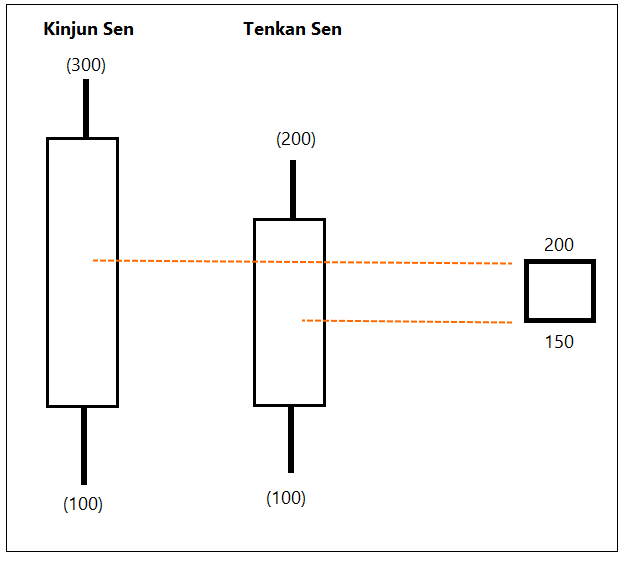
TL = 9-bar average price
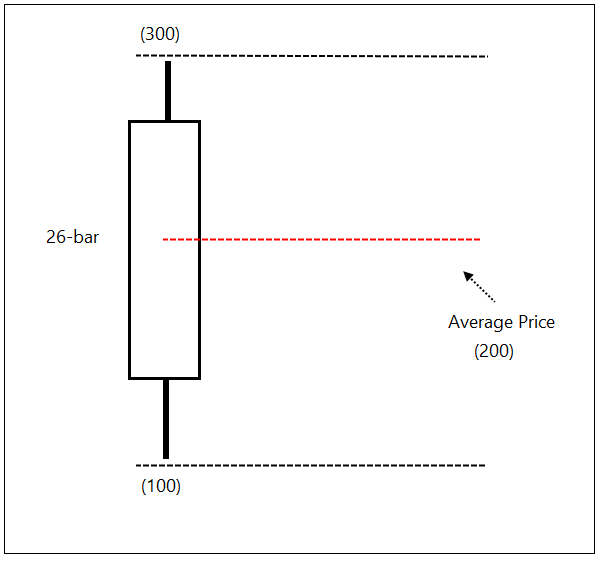
KL = 26-bar average price
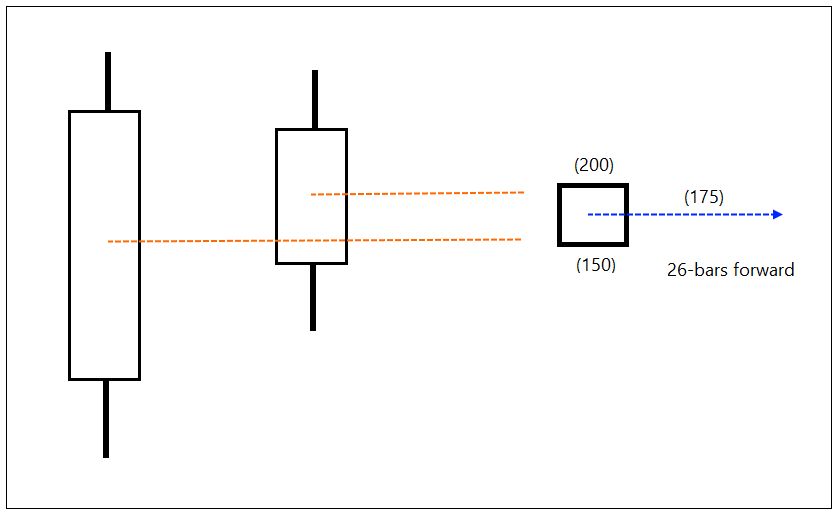
Span A = Average of TL & KL 26-days before
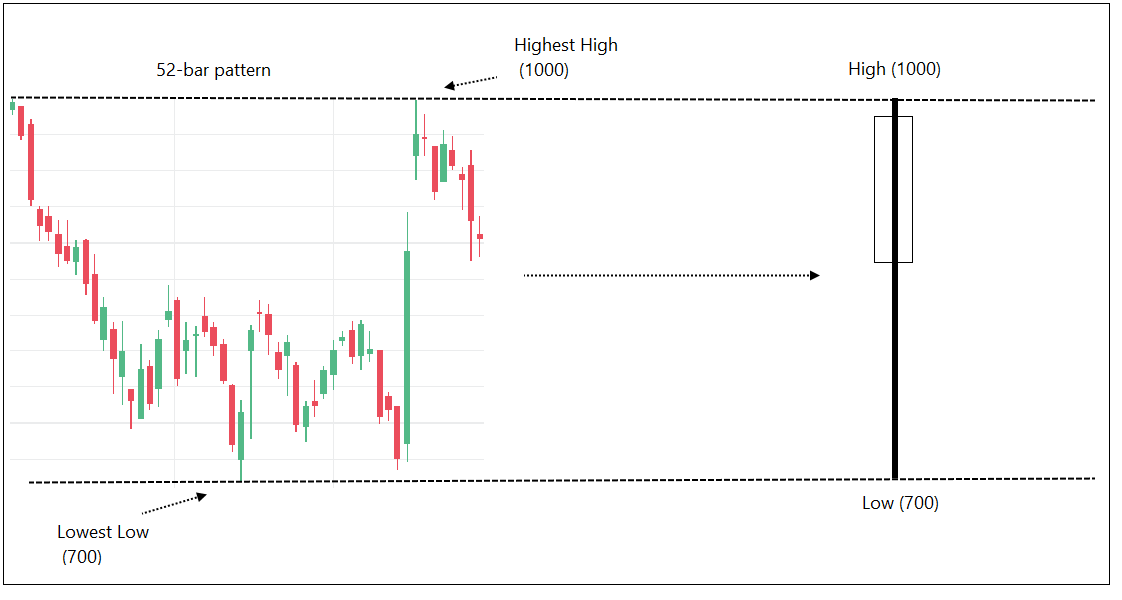
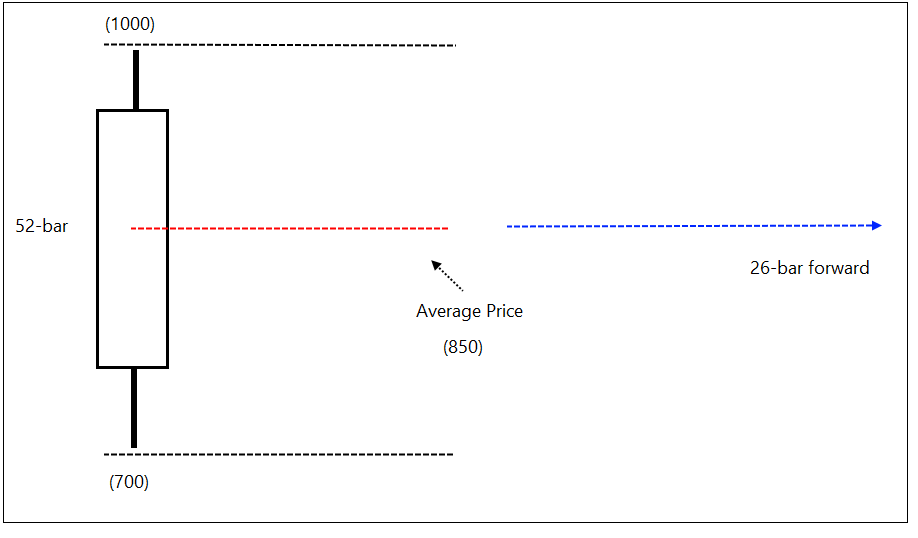
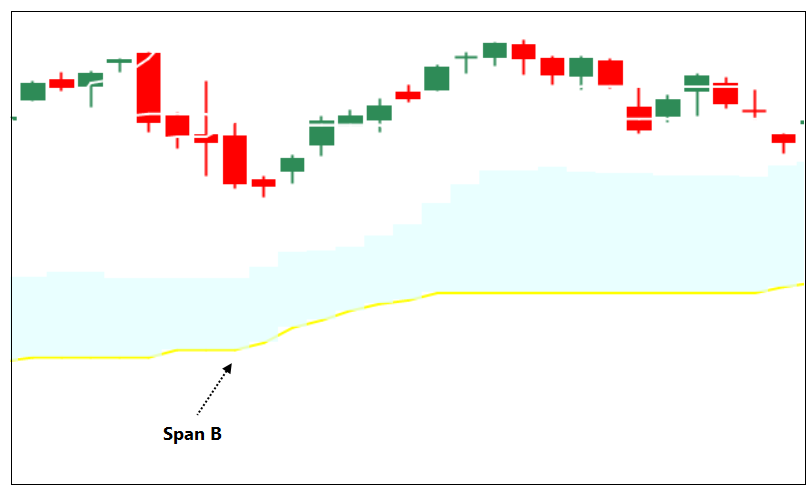
Span B = 52-bar average price of 26-days before
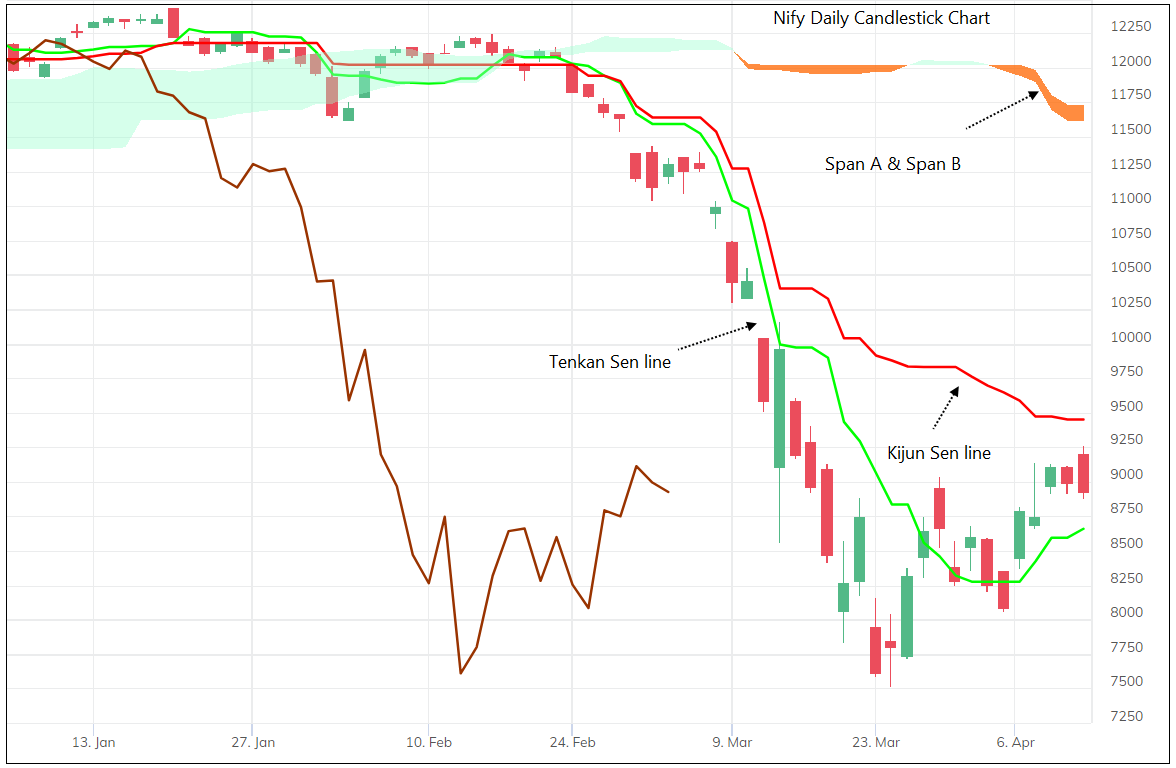
TL > KL = Bullish
If it is above clouds and if clouds are bullish – it is a strong bullish signal.
TL < KL = Bearish
If it is below clouds and if clouds are bearish – it is a strong bullish signal.
When price is between clouds – avoid taking trading signals.
9-26-62 are default periods. You can change that and experiment with different parameters.
There can be more rules and there are many traders following this method.
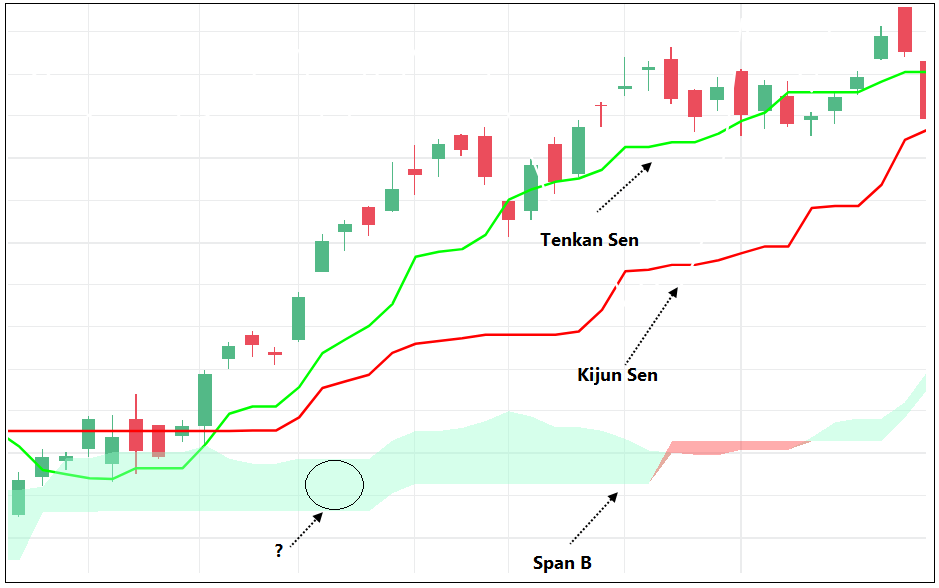
Tenkan Sen = Conversion Line
Kinjun Sen = Base Line
Senkou Span A = Leading Span A
Senkou Span B = Leading Span B
There is one more line – Chikou span (Lagging Span) in Ichimoku indicator. I will explain that next time.
End of thread.

