Thread on Average True Range (ATR) indicator. 
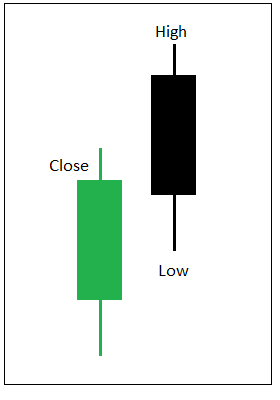
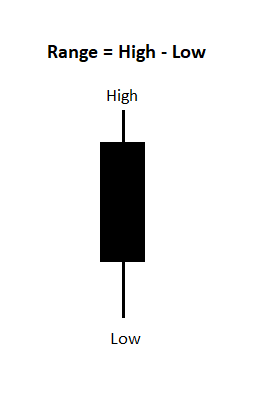
Range of any candle is a difference between its High and Low price.
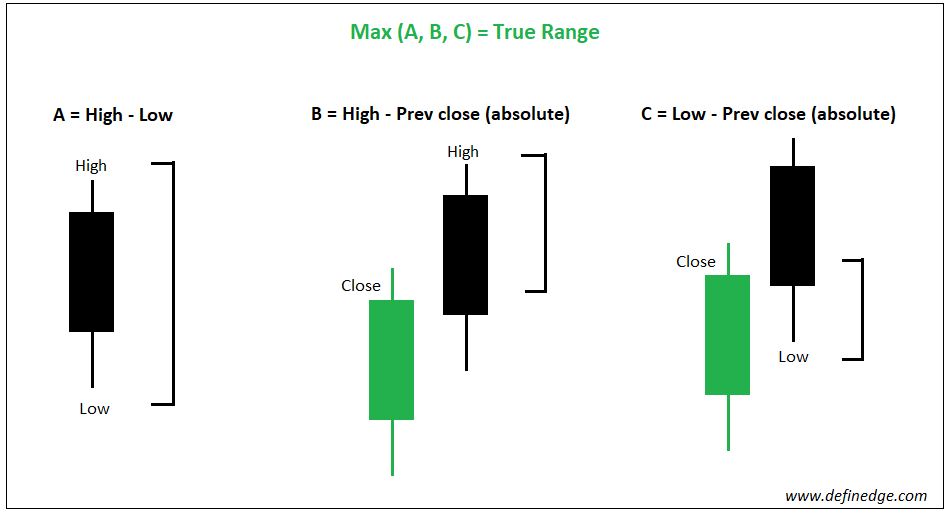
J. Welles Wilder introduced a concept called True Range. Formula of True Range:
Maximum of (Current High – Current Low, Current High – Prev Close, Current Low – Prev Close).
Maximum of (Current High – Current Low, Current High – Prev Close, Current Low – Prev Close).
The average price of true range over last several candles is known as Average True Range. 14-day period suggested by Wilder is popular and widely used parameter for ATR.
ATR indicator is used to measure volatility. It is also used by traders while determining the stop-loss.
ATR indicator is used to measure volatility. It is also used by traders while determining the stop-loss.
But if I want to compare current ATR with the past reading, absolute ATR reading might not be useful.
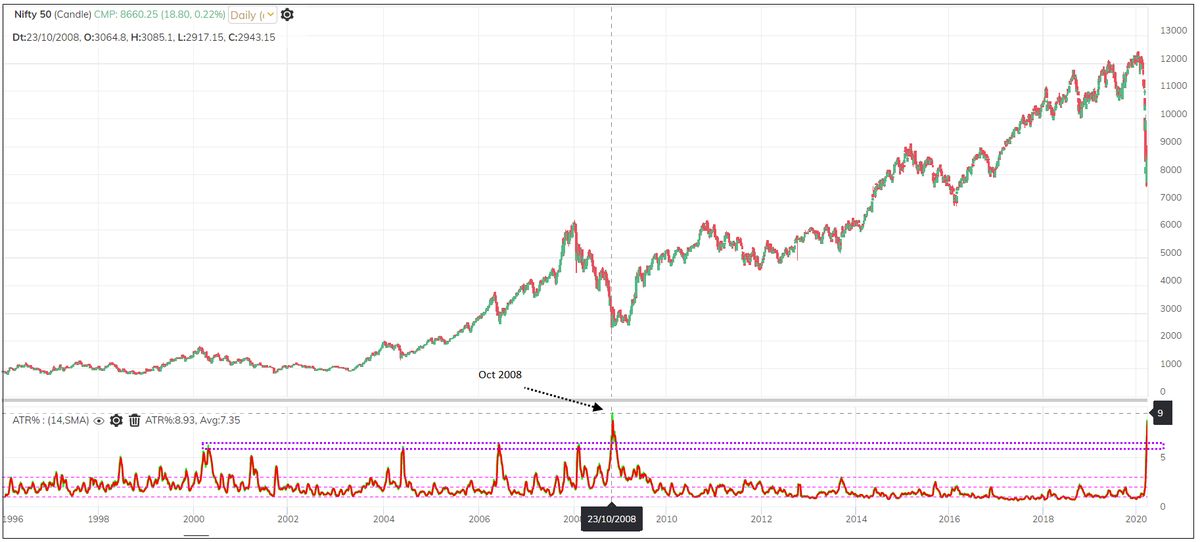
Current 14-day ATR of Nifty is 730 points. If I want to check the behaviour in past during volatile times such as 2008, this information is not useful as Nifty range was different then.
What is more logical then?
What is more logical then?
Percentage of ATR in relation to the prevailing price would make comparison across time periods meaningful. So, current 14-day ATR% reading of Nifty is 8.43%. Now, this can be compared with past data for meaningful comparison
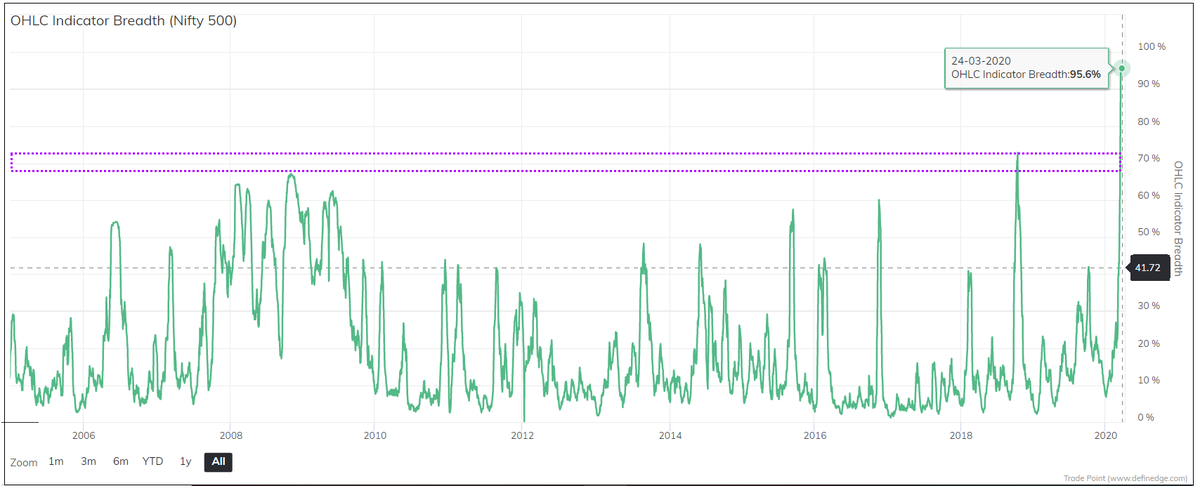
Prior to the recent crash, the ATR% for Nifty went above 5% way back in 2008. It peaked around 9.41% in Oct 2008. Hence, Nifty is close to its all-time-high volatility levels. Current ATR% reading of Nifty 500 is around 8.08%. It was also around same levels in Oct 2008.
If we check ATR% reading of stocks, more than 95% of stocks of Nifty 500 universe are above the 5% range. And all stocks of Nifty 50 universe are above that range.
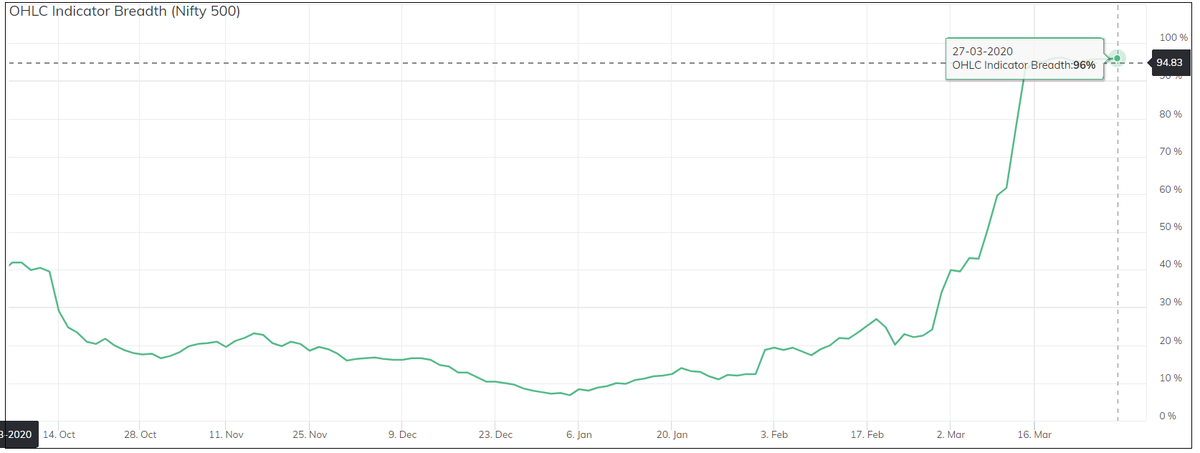
This has happened for the first time. The usual ATR% range for stocks is between 2% -5%.
What should we expect next?
Like everything else, volatility too is cyclical. After current expansion, a range contraction is the likely outcome, but we don’t know when this would happen.
Like everything else, volatility too is cyclical. After current expansion, a range contraction is the likely outcome, but we don’t know when this would happen.
Current situation is so unprecedented that we might see further spike in volatility before it subsides.
From trading perspective, unless stocks revert to their usual range, the current method that you are following needs to wait.
From trading perspective, unless stocks revert to their usual range, the current method that you are following needs to wait.
Hint to the system traders: When ATR% reading of any instrument makes a 30 days high, the strategy needs a tweak. It is like how options strategies are treated based on IV.
Moves that used to happen in months are happening in a day now. Derivative traders need to shift to lower time-frame even for positional trading.
I find the objective set-ups in P&F and Renko in one-min timeframe to very helpful in this context. The box-size or brick-size needs to be increased in this environment (1.5x to 2x of what you were using earlier) to accommodate volatility spike. (End of thread).