Use of care and mortality due to corona in Finland, Sweden, Norway, Denmark, Iceland and Estonia; data from yesterday 16.4.
Read the whole thread. (English)
Fig 1. Number of persons in intensive care per day. Measures the burden on intensive care capacity. 1/x
Read the whole thread. (English)
Fig 1. Number of persons in intensive care per day. Measures the burden on intensive care capacity. 1/x

Fig 2. Number of persons in hospital care per day. One person can be counted for several days. Measures the burden on hospital capacity. 2/x

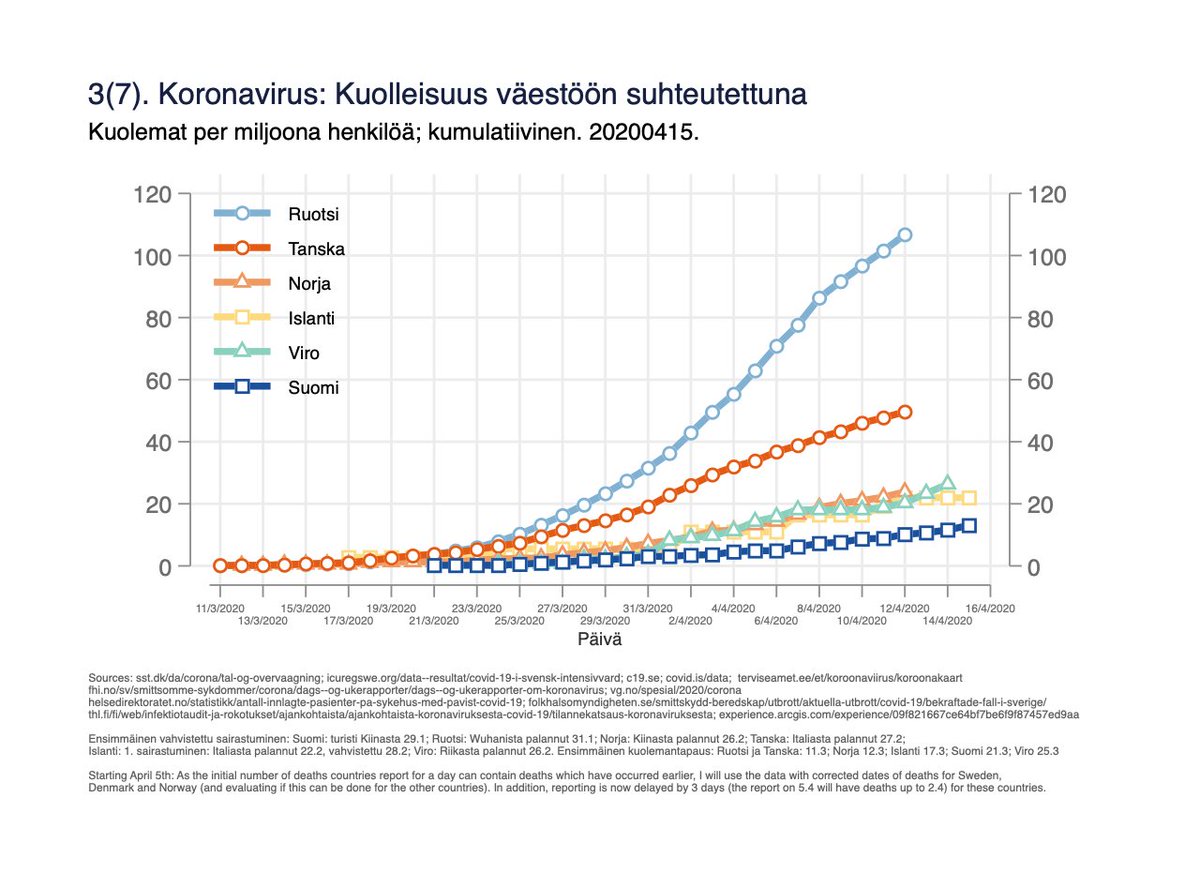
Fig 3. Mortality per million population. 3/x

Fig 4. Mortality per million population on log-scale, by days since 2/million deaths in the country. Same data as fig 3, but y-axis helps to understand rate of change, and time-scale unified. 4/x

Fig 5. Absolute number of deaths by days since 10th death in the country.
(Attempts to get same starting point/phase of the epidemic for all countries). 5/x
(Attempts to get same starting point/phase of the epidemic for all countries). 5/x

Geographical differences within Finland; might be of interest to other countries to understand the spread&trend between the capital area (Helsinki) vs rest.
Fig 6. Nr of persons in intensive care/day by the five “specialised medical care regions”: 6/x
Fig 6. Nr of persons in intensive care/day by the five “specialised medical care regions”: 6/x

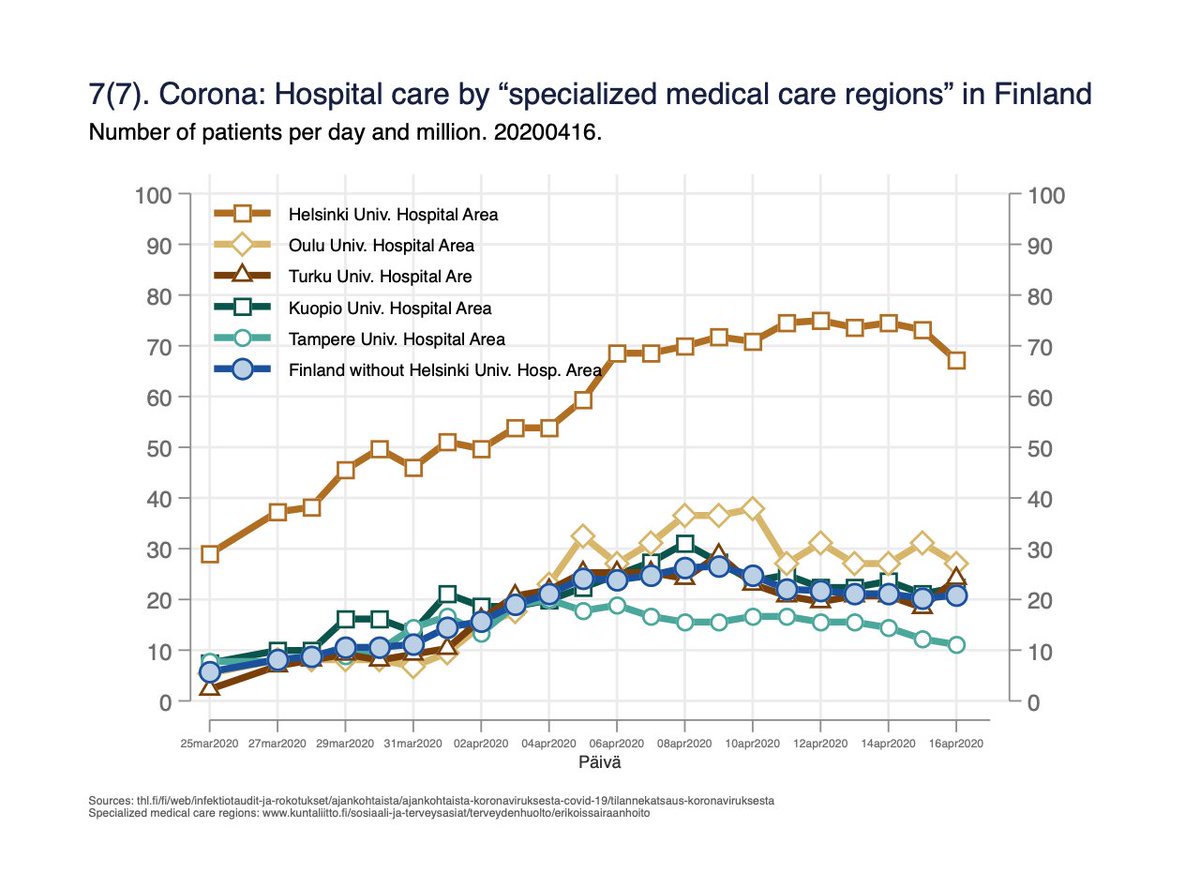
Fig 7. Number of persons in hospital care per day by the five “specialised medical care regions”: 7/x
Bonus figure for some perspective: yesterday I compared some Euro-countries-> variation within the Nordics limited (even if does not seem that way).
Including today South Korea to fig 5 (Hopkins data), absolute number of deaths by days since 10th death in the country. 8/x
Including today South Korea to fig 5 (Hopkins data), absolute number of deaths by days since 10th death in the country. 8/x

Attempts to get same starting phase of the epidemic for countries. Initially, abs numbers does not depend on the pop. size. If the start+speed same, the lines follow each other. Many things affect speed; contacts, demographics, culture etc. Death not optimal; crude picture. 9/x
The “new unique ICU patients/day” is good measure for changes (not available for all countries); still stable in Sweden, see the figure “Nya unika coronapatienter på IVA i Sverige”: 10/x
svt.se/datajournalist…
svt.se/datajournalist…
Clarification: I work at THL but my work is not related to corona (but dementia/diabetes); everything here my own opinions.
All data from public sources; also the Finnish data.
I’m not an expert on infectious disease epidemiology. Trust me.
11/11
All data from public sources; also the Finnish data.
I’m not an expert on infectious disease epidemiology. Trust me.
11/11