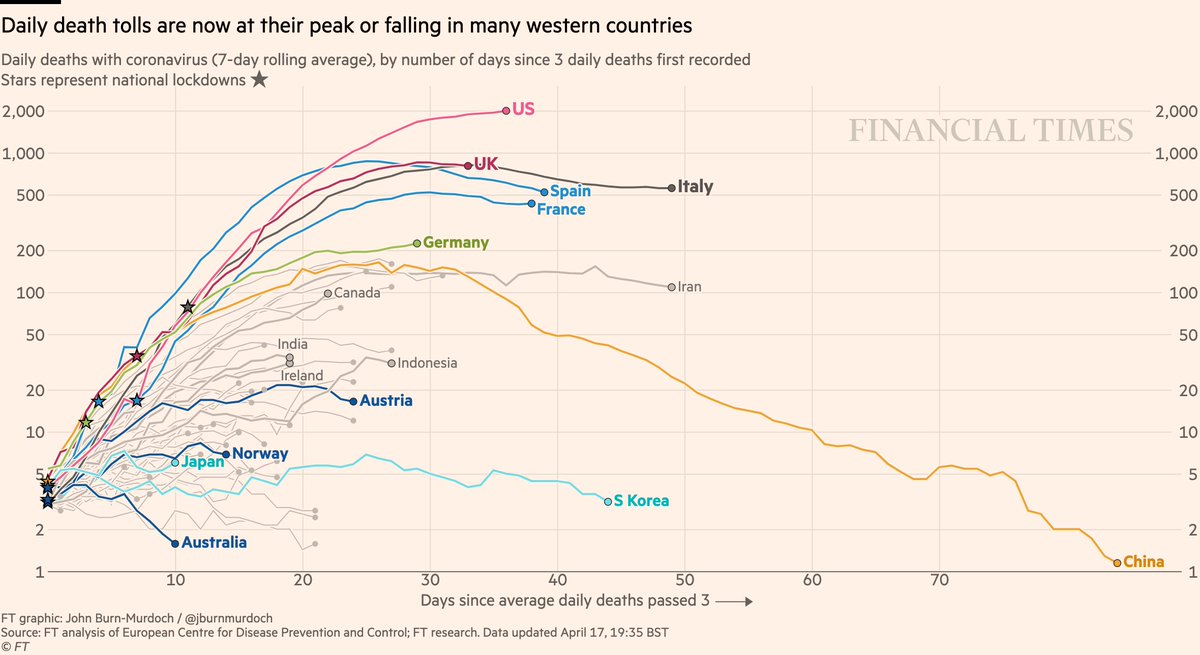
NEW: Fri 17 April update of coronavirus trajectories
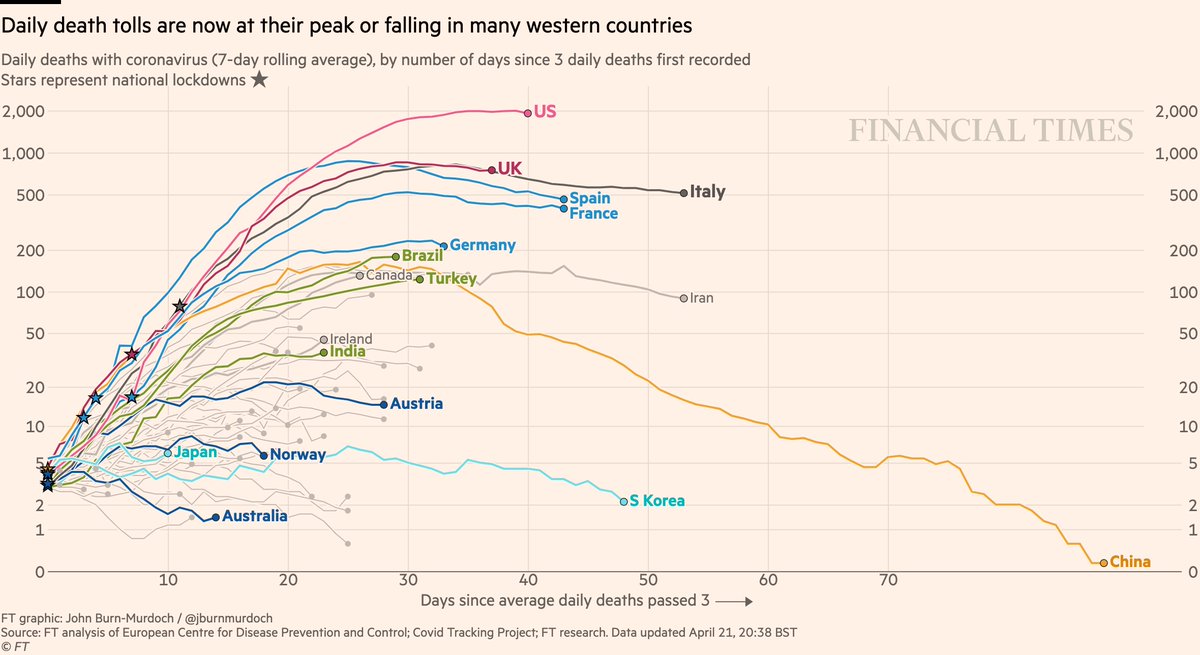
Daily deaths
• US & UK may be peaking, still too early to say
• Successes in dark blue: Australia, Norway, Austria locked down early => gentle slopes
• We’ve added >1000 deaths in China
Live charts: ft.com/coronavirus-la…
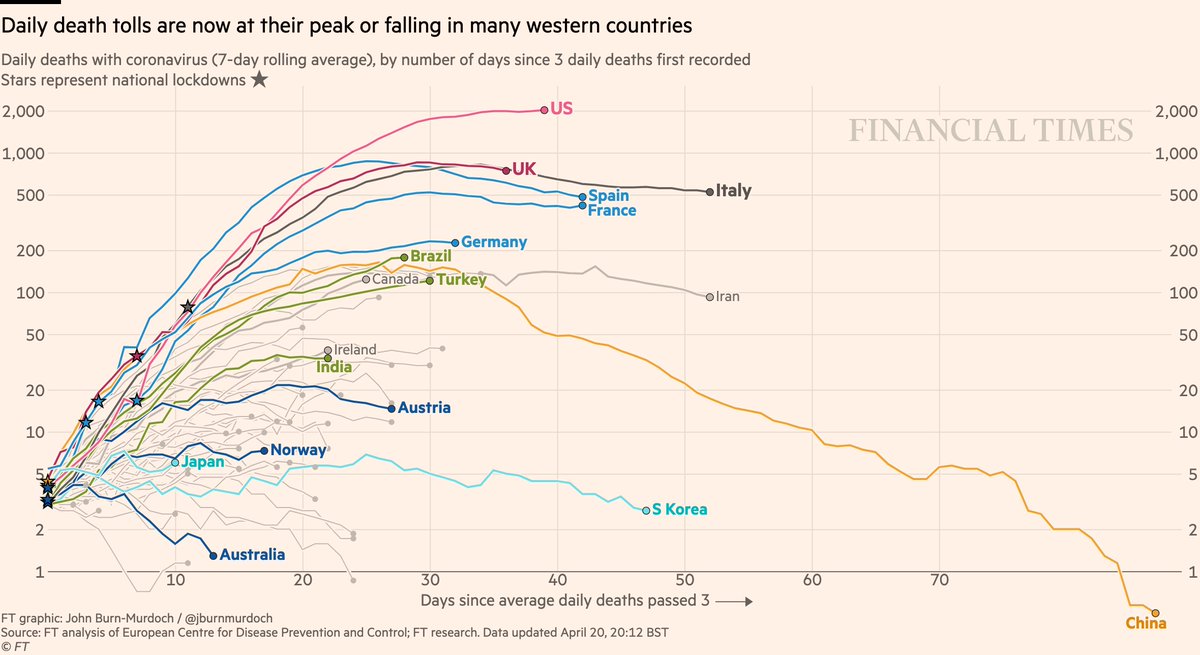
Daily deaths
• US & UK may be peaking, still too early to say
• Successes in dark blue: Australia, Norway, Austria locked down early => gentle slopes
• We’ve added >1000 deaths in China
Live charts: ft.com/coronavirus-la…
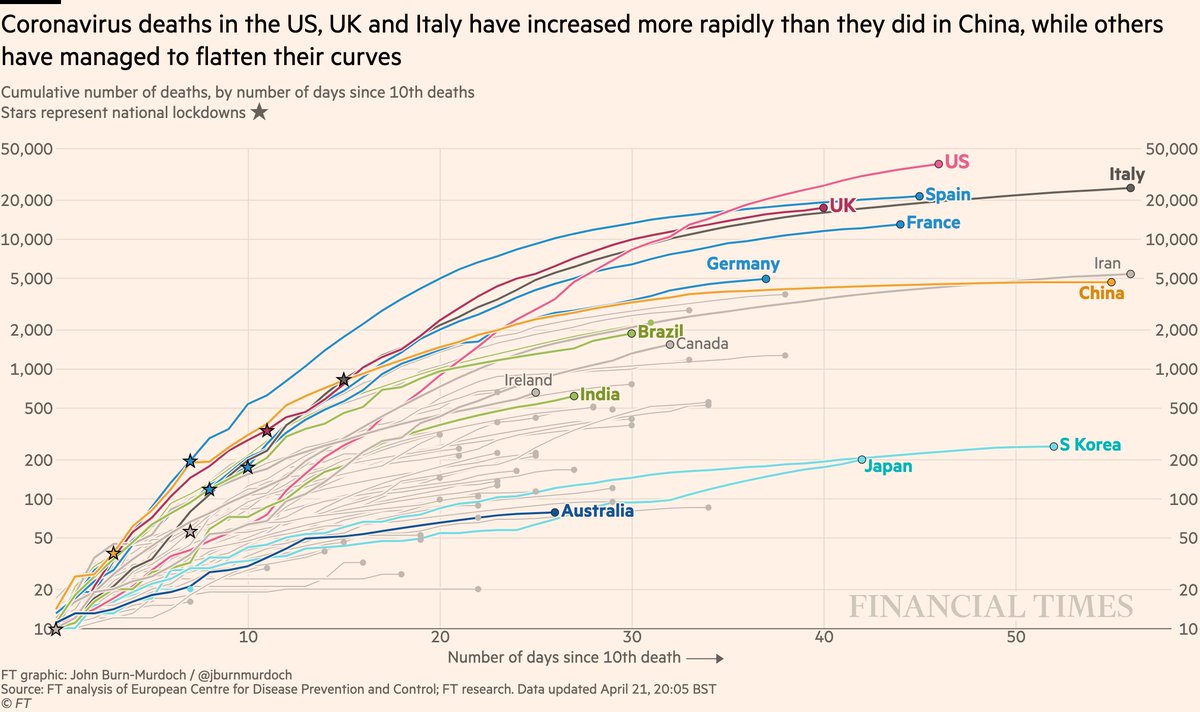
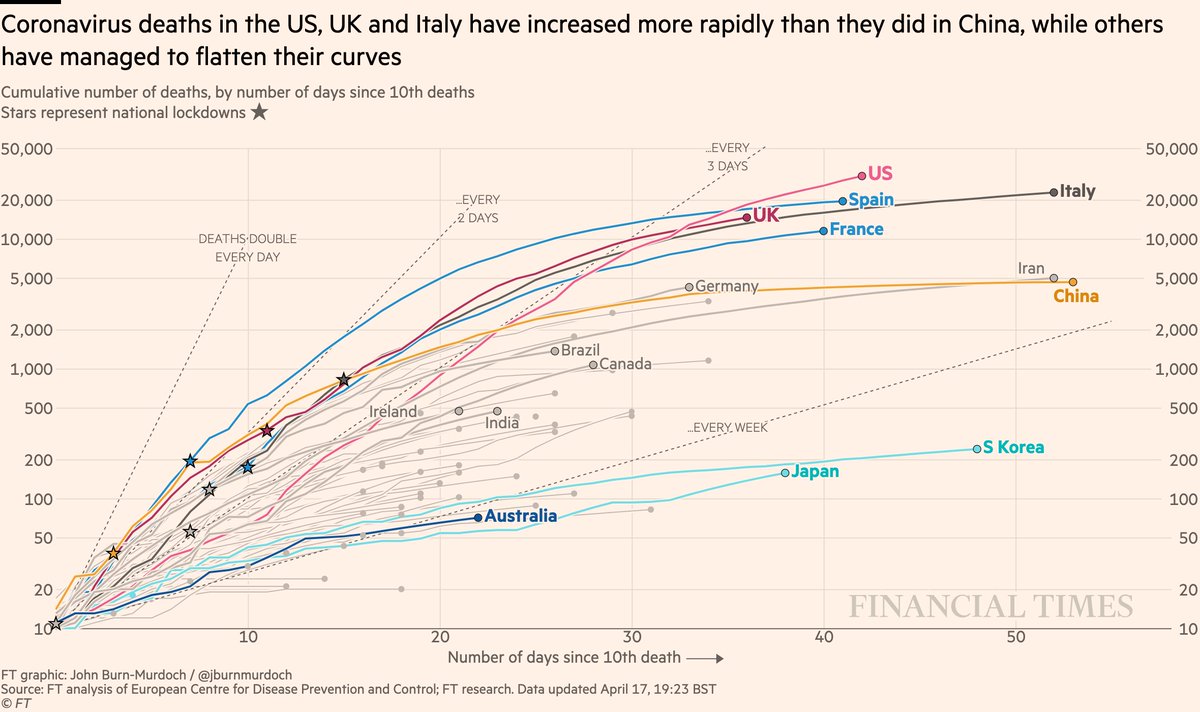
Now cumulative deaths:
• US death is highest worldwide and still rising fast 📈
• UK curve still matching Italy’s
• Australia still looks promising
• China revision elevates its curve to match Germany’s
All charts: ft.com/coronavirus-la…
• US death is highest worldwide and still rising fast 📈
• UK curve still matching Italy’s
• Australia still looks promising
• China revision elevates its curve to match Germany’s
All charts: ft.com/coronavirus-la…
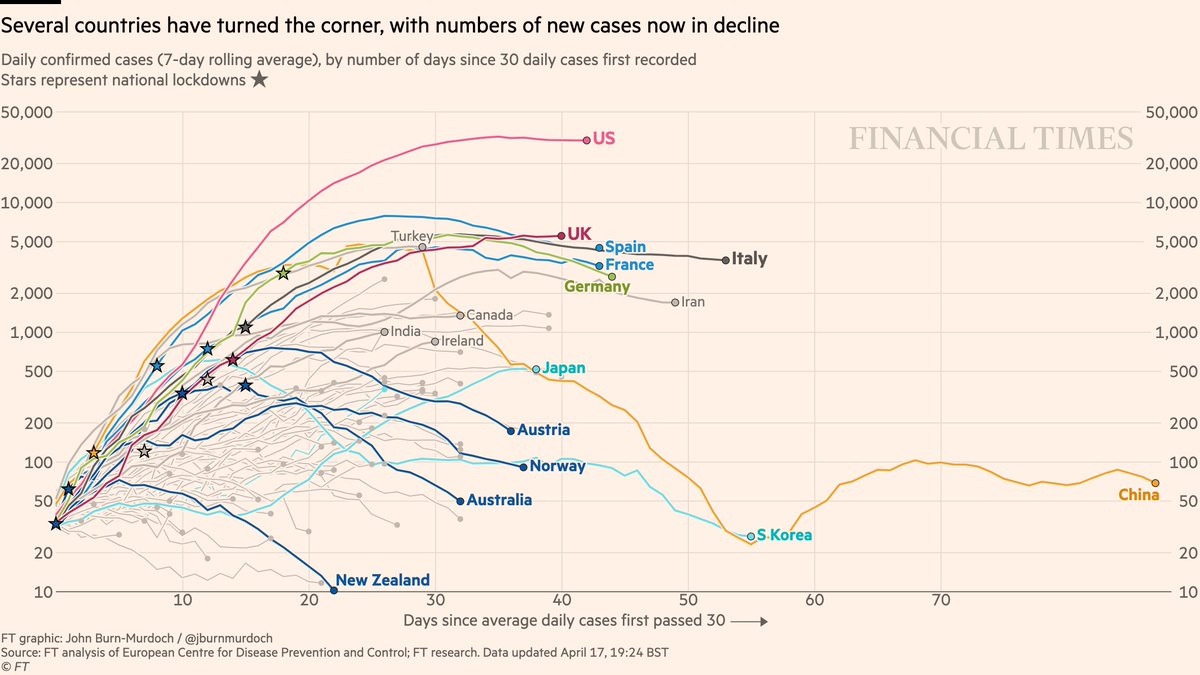
Now daily new cases:
• Feels increasingly safe to say daily confirmed infections in US have peaked
• UK is testing less, so less sure
• New cases falling in four countries that acted early: New Zealand (!), Australia, Norway, Austria 📉
All charts: ft.com/coronavirus-la…
• Feels increasingly safe to say daily confirmed infections in US have peaked
• UK is testing less, so less sure
• New cases falling in four countries that acted early: New Zealand (!), Australia, Norway, Austria 📉
All charts: ft.com/coronavirus-la…
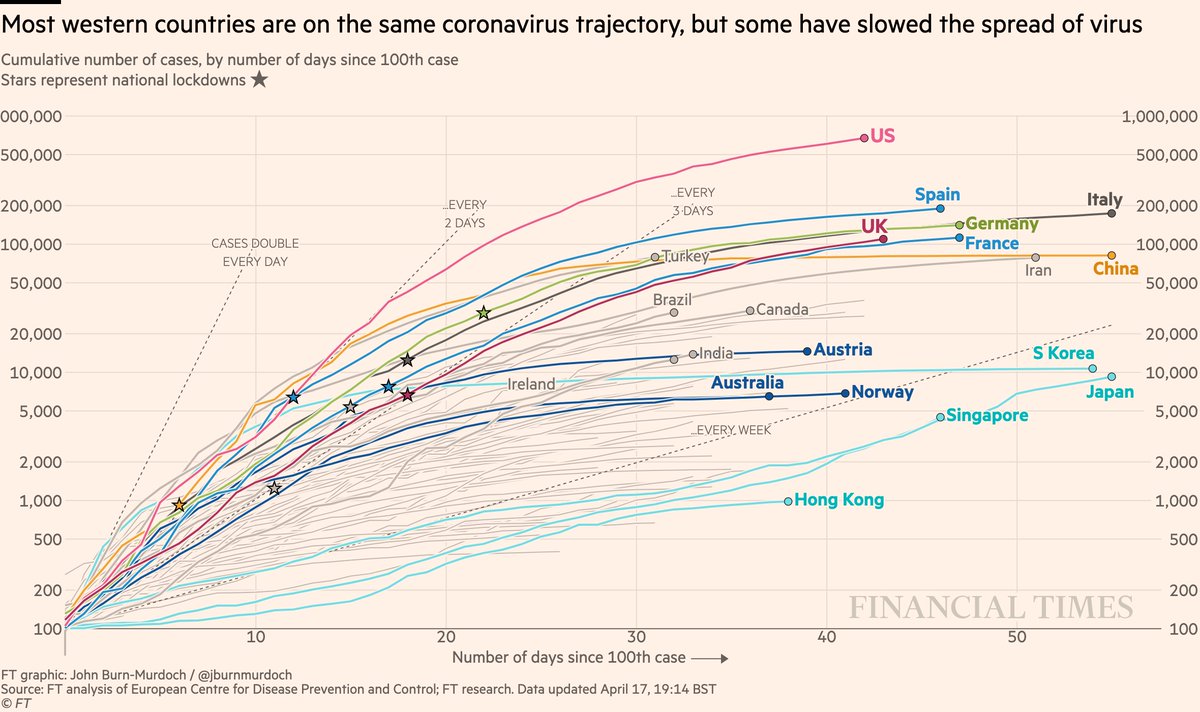
Cases in cumulative form:
• US curve beginning to taper
• Turkey still battling a severe outbreak
• Japan will soon pass Korea
• Curves flattened early in Austria, Australia, Norway
All charts: ft.com/coronavirus-la…
• US curve beginning to taper
• Turkey still battling a severe outbreak
• Japan will soon pass Korea
• Curves flattened early in Austria, Australia, Norway
All charts: ft.com/coronavirus-la…
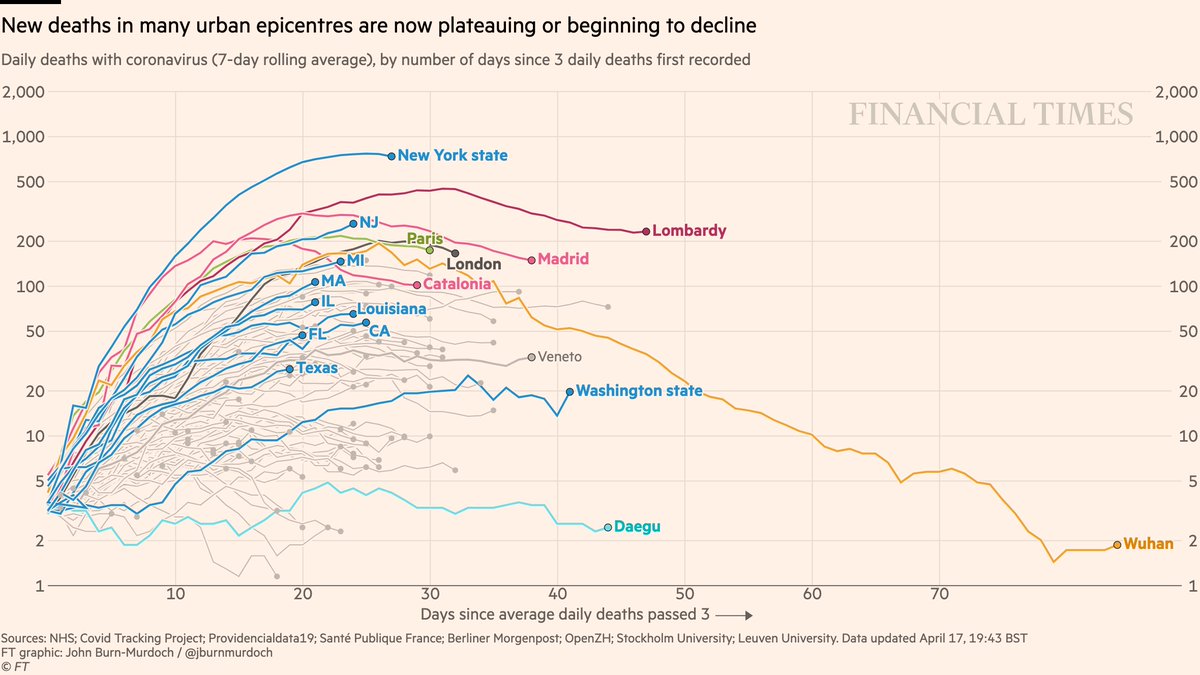
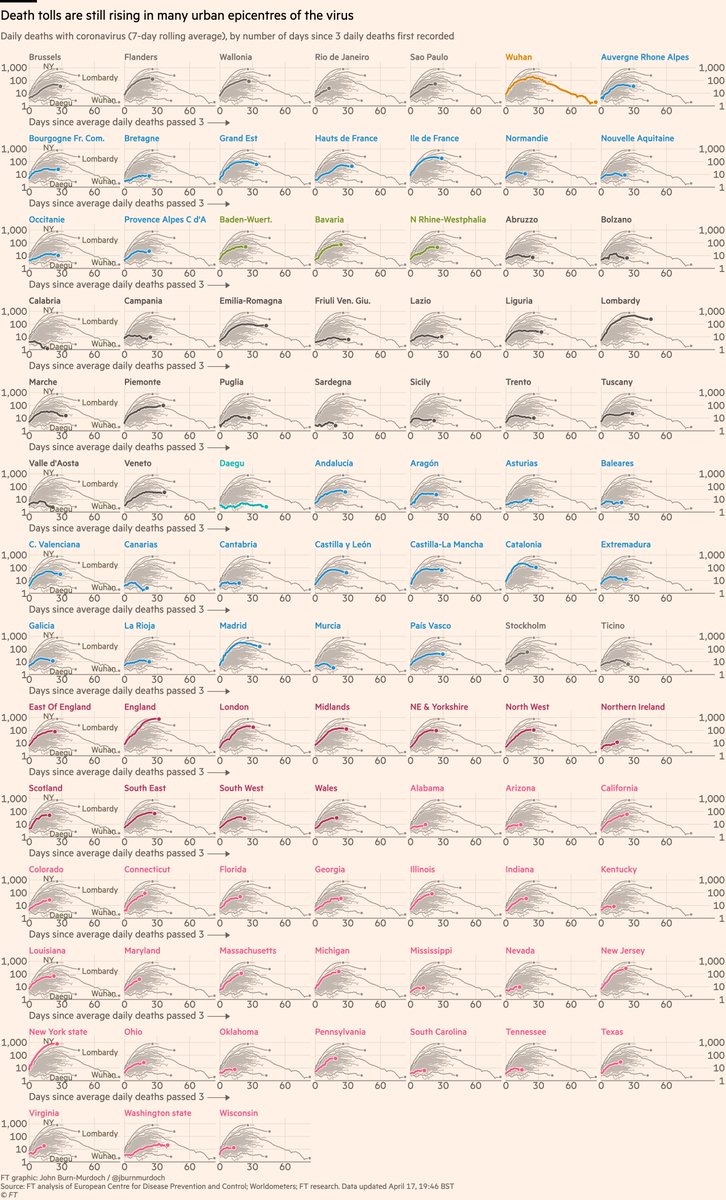
Subnational region daily deaths:
• We’ve added 1,290 deaths in Wuhan
• NY daily deaths peaking? (we’re excluding nursing homes for consistency)
• London may have passed peak deaths
• Texas added. Daily deaths trending up in many US states
All charts: ft.com/coronavirus-la…
• We’ve added 1,290 deaths in Wuhan
• NY daily deaths peaking? (we’re excluding nursing homes for consistency)
• London may have passed peak deaths
• Texas added. Daily deaths trending up in many US states
All charts: ft.com/coronavirus-la…
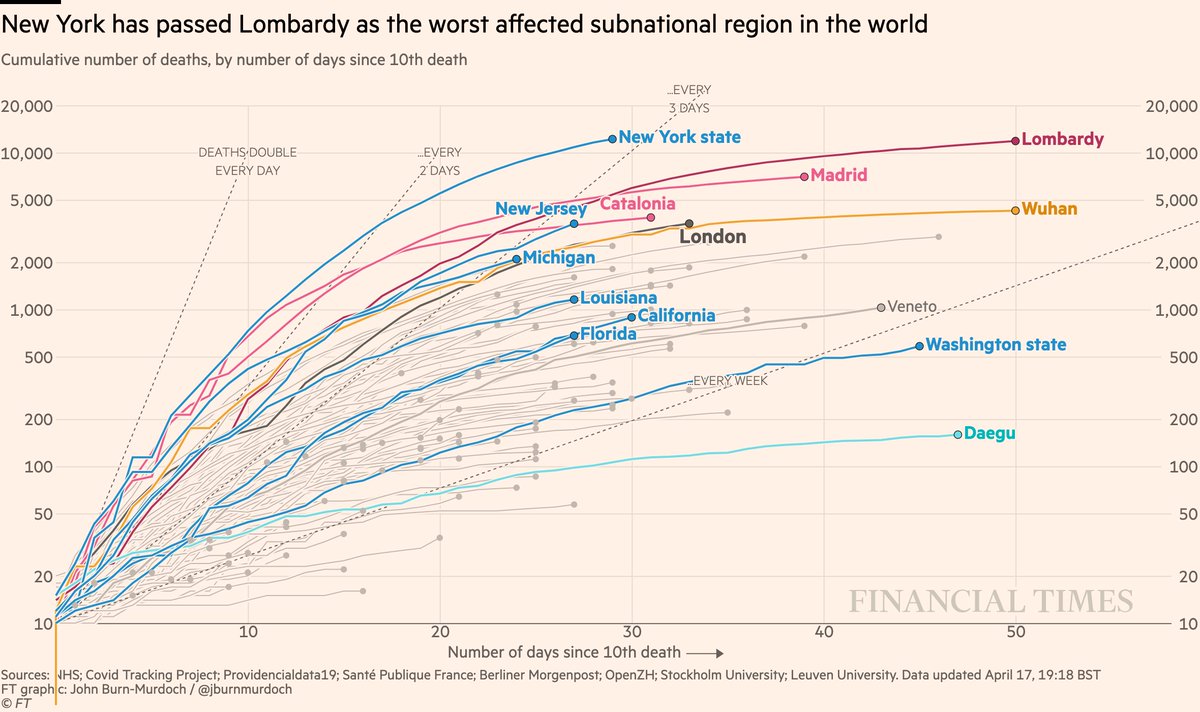
Subnational death tolls cumulatively:
• Revised deaths in Wuhan shift its curve up to match London
• NY curve tapering, but has passed Lombardy for world’s highest subnational death toll
All charts: ft.com/coronavirus-la…
• Revised deaths in Wuhan shift its curve up to match London
• NY curve tapering, but has passed Lombardy for world’s highest subnational death toll
All charts: ft.com/coronavirus-la…
Small multiples of daily deaths in subnational regions, grouped by country
• 27 US states, steepest curves include CT, IL, MD, MA, PA
• Sicily, Sardinia, Balearics, Canaries all low curves: do islands fare better?
All charts: ft.com/coronavirus-la…
• 27 US states, steepest curves include CT, IL, MD, MA, PA
• Sicily, Sardinia, Balearics, Canaries all low curves: do islands fare better?
All charts: ft.com/coronavirus-la…
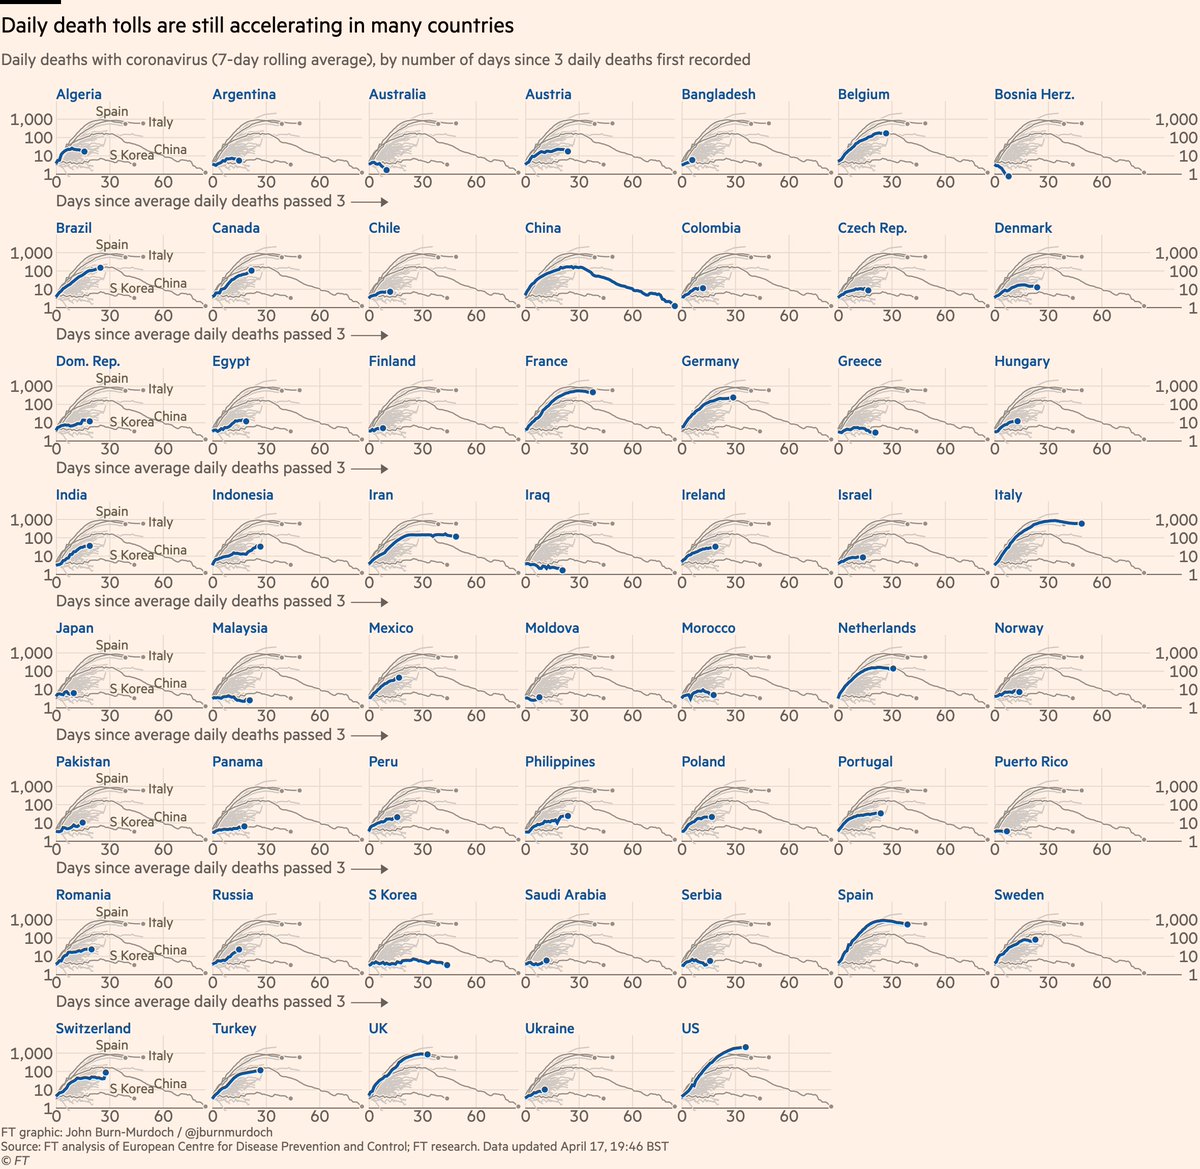
Small multiples for daily new deaths in countries:
• Norway locked down while Sweden didn’t; Norway’s daily death toll rising much more slowly than Sweden’s
• Australia faring well so far
• In Europe, Austria, Denmark & Norway faring well
All charts: ft.com/coronavirus-la…
• Norway locked down while Sweden didn’t; Norway’s daily death toll rising much more slowly than Sweden’s
• Australia faring well so far
• In Europe, Austria, Denmark & Norway faring well
All charts: ft.com/coronavirus-la…
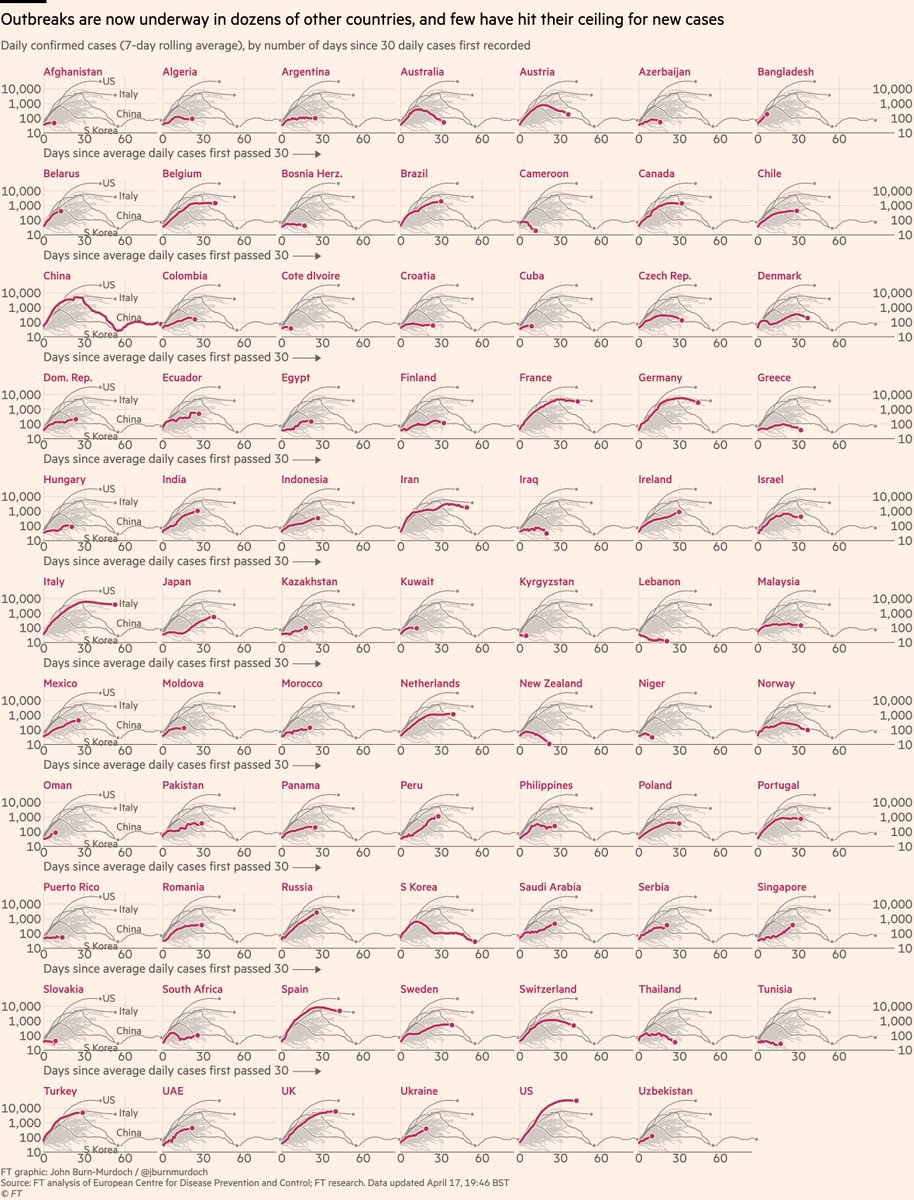
Small multiples for daily cases in 76 countries:
• Bangladesh sill rising steeply
• Early action in Australia & New Zealand may have turned corner 🇦🇺🇳🇿📉
• Austria & Norway locked down early & new cases falling
Live versions of all charts: ft.com/coronavirus-la…
• Bangladesh sill rising steeply
• Early action in Australia & New Zealand may have turned corner 🇦🇺🇳🇿📉
• Austria & Norway locked down early & new cases falling
Live versions of all charts: ft.com/coronavirus-la…
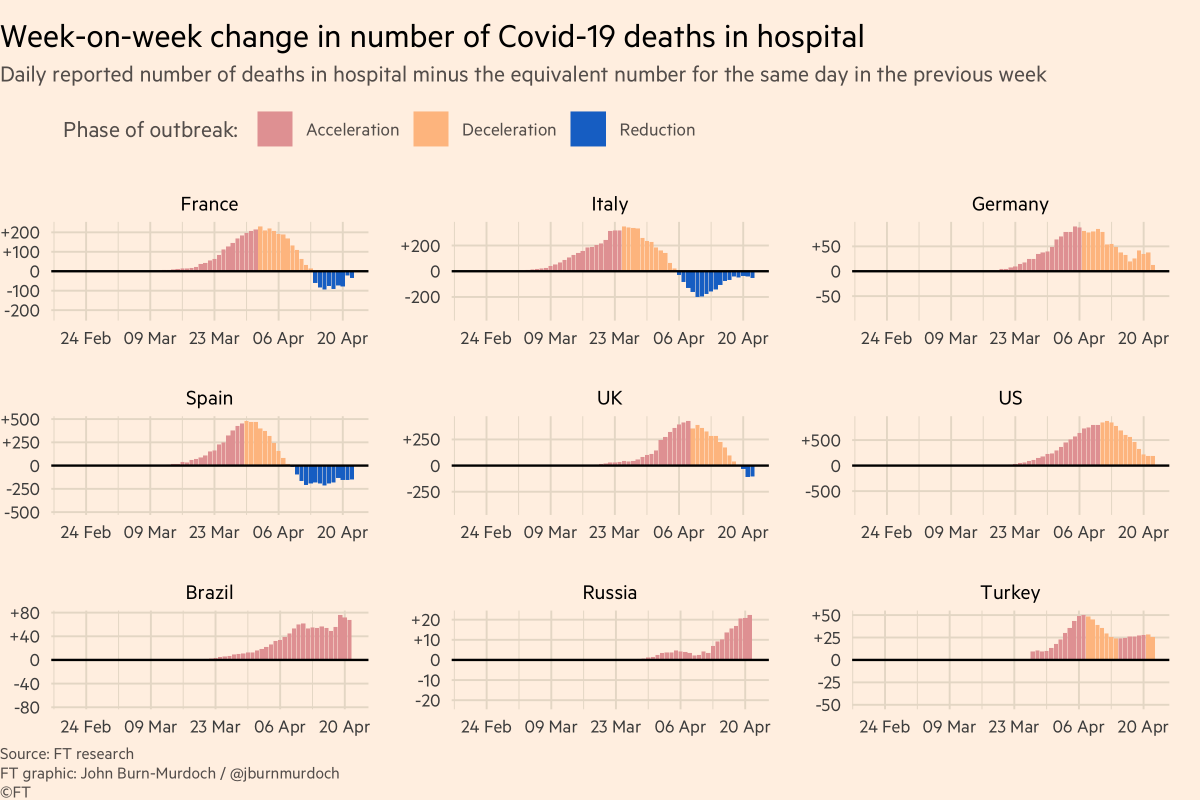
I talk a lot about whether or not peaks have been reached.
A good metric for this is hospitalisations:
• More reliable than confirmed cases (not influenced by testing regimes)
• Shorter lag than deaths
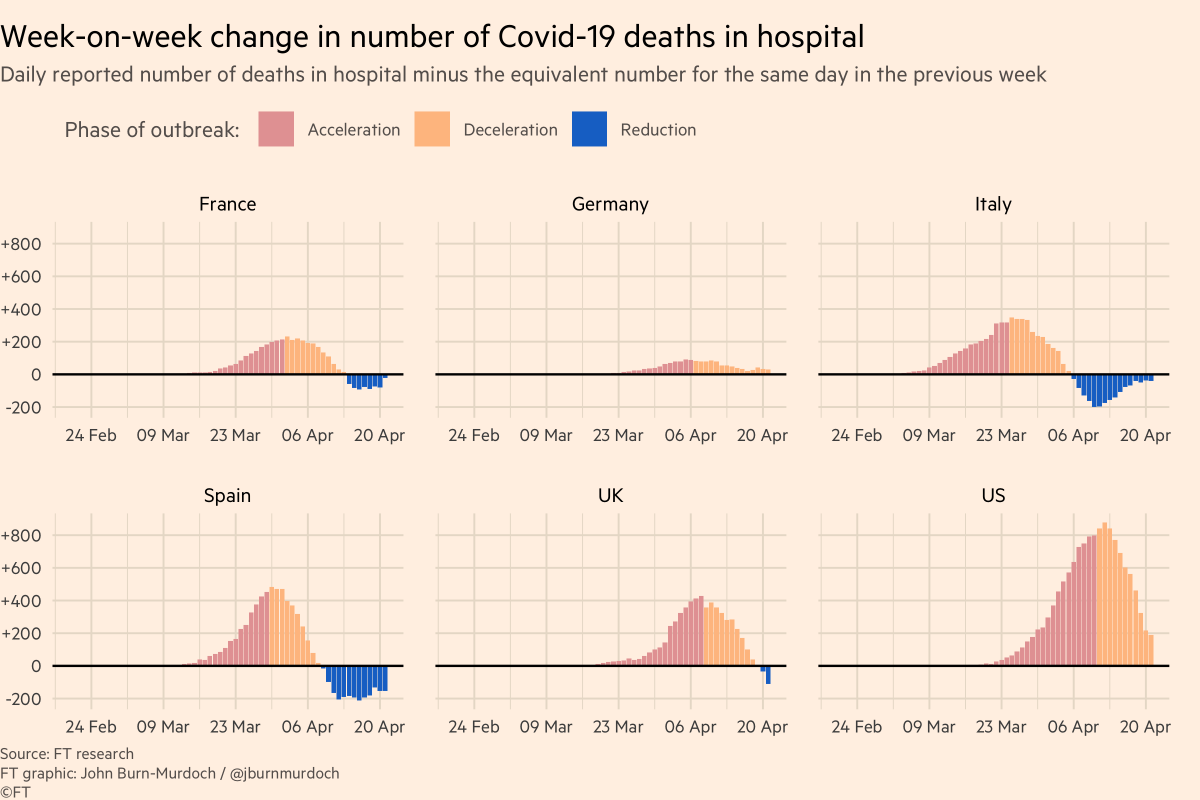
So here are some charts showing hospitalisations in various countries:
A good metric for this is hospitalisations:
• More reliable than confirmed cases (not influenced by testing regimes)
• Shorter lag than deaths
So here are some charts showing hospitalisations in various countries:
First, Italy:
Colour = phase of outbreak
• Red: more new hospitalisations every day than day before
• Orange: total hospitalisations rising, but rate of increase slowing
• Blue: fewer people in hospital than before
Almost all Italian regions now in "reduction" phase :-)
Colour = phase of outbreak
• Red: more new hospitalisations every day than day before
• Orange: total hospitalisations rising, but rate of increase slowing
• Blue: fewer people in hospital than before
Almost all Italian regions now in "reduction" phase :-)

Next, Spain:
• Madrid now firmly in the "reduction" phase
• Catalonia may be following suit
• But in most other regions, although the rate of increase has slowed, each day still brings more new hospitalisations than discharges
• Madrid now firmly in the "reduction" phase
• Catalonia may be following suit
• But in most other regions, although the rate of increase has slowed, each day still brings more new hospitalisations than discharges

France:
• Rate of increase in hospitalisations dropping across the board, but most regions yet to see total occupancy fall
• Rate of increase in hospitalisations dropping across the board, but most regions yet to see total occupancy fall

US:
• Hospitalisation data is patchy from state to state
• NY and Louisiana both entering the "reduction" phase, hospital bed occupancy dropping 👍
• Rate of acceleration falling in New Jersey, but overall numbers still rising
• Hospitalisation data is patchy from state to state
• NY and Louisiana both entering the "reduction" phase, hospital bed occupancy dropping 👍
• Rate of acceleration falling in New Jersey, but overall numbers still rising

UK:
• London’s hospitals now have fewer covid patients with each day 👍
• Rate of increase slowing elsewhere across UK, and some other regions seeing net daily falls
• Suggests UK could be at or near peak for new infections
• London’s hospitals now have fewer covid patients with each day 👍
• Rate of increase slowing elsewhere across UK, and some other regions seeing net daily falls
• Suggests UK could be at or near peak for new infections

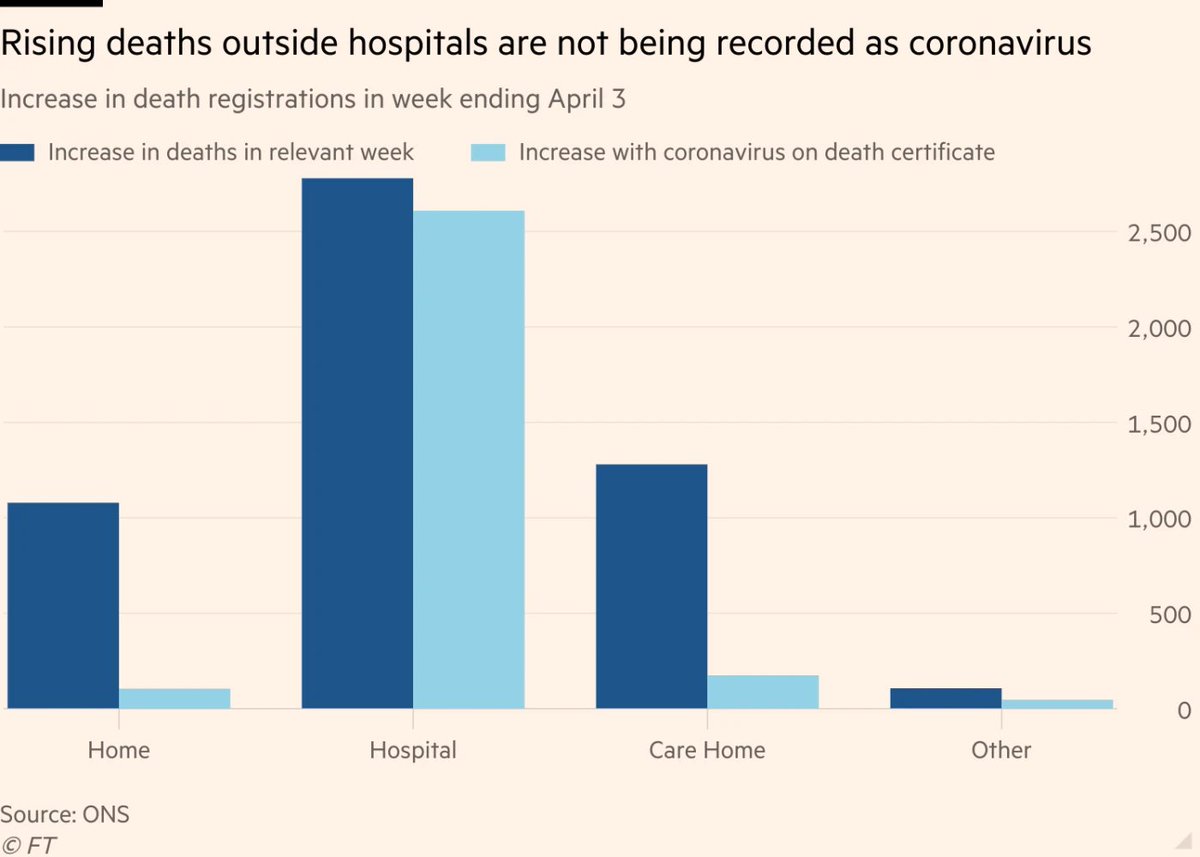
Wrapping up: our focus has now shifted to tracking excess all-cause mortality (numbers of people dying for any reason at all) as we think this avoids pitfalls of different countries’ covid-death reporting methodologies.
So my call-out tonight is:
Please point me to data on all-cause mortality (total numbers of deaths from all causes) in your country, by week, up to and including recent weeks 🙏
Reply here, email coronavirus-data@ft.com or add a link to this spreadsheet: docs.google.com/spreadsheets/d…
Please point me to data on all-cause mortality (total numbers of deaths from all causes) in your country, by week, up to and including recent weeks 🙏
Reply here, email coronavirus-data@ft.com or add a link to this spreadsheet: docs.google.com/spreadsheets/d…
Final bits:
Here’s a video where I explain why we’re using log scales, showing absolute numbers instead of per capita, and much more:
Here’s a video where I explain why we’re using log scales, showing absolute numbers instead of per capita, and much more:
And a chart showing why we're using absolute numbers rather than population-adjusted rates:
Please email coronavirus-data@ft.com with feedback, requests & subnational data.
All of these are invaluable, and we incorporate your suggestions and data every day.
We’ll keep getting back to as many people as possible.
Happy Friday, folks :-)
All of these are invaluable, and we incorporate your suggestions and data every day.
We’ll keep getting back to as many people as possible.
Happy Friday, folks :-)
Now onto the main event

That'll do it