Use of care and mortality due to corona in Finland, Sweden, Norway, Denmark, Iceland and Estonia; data from yesterday 23.4.
Read the whole thread. (English)
Fig 1. Number of persons in intensive care per day. Measures the burden on intensive care capacity. 1/x
Read the whole thread. (English)
Fig 1. Number of persons in intensive care per day. Measures the burden on intensive care capacity. 1/x

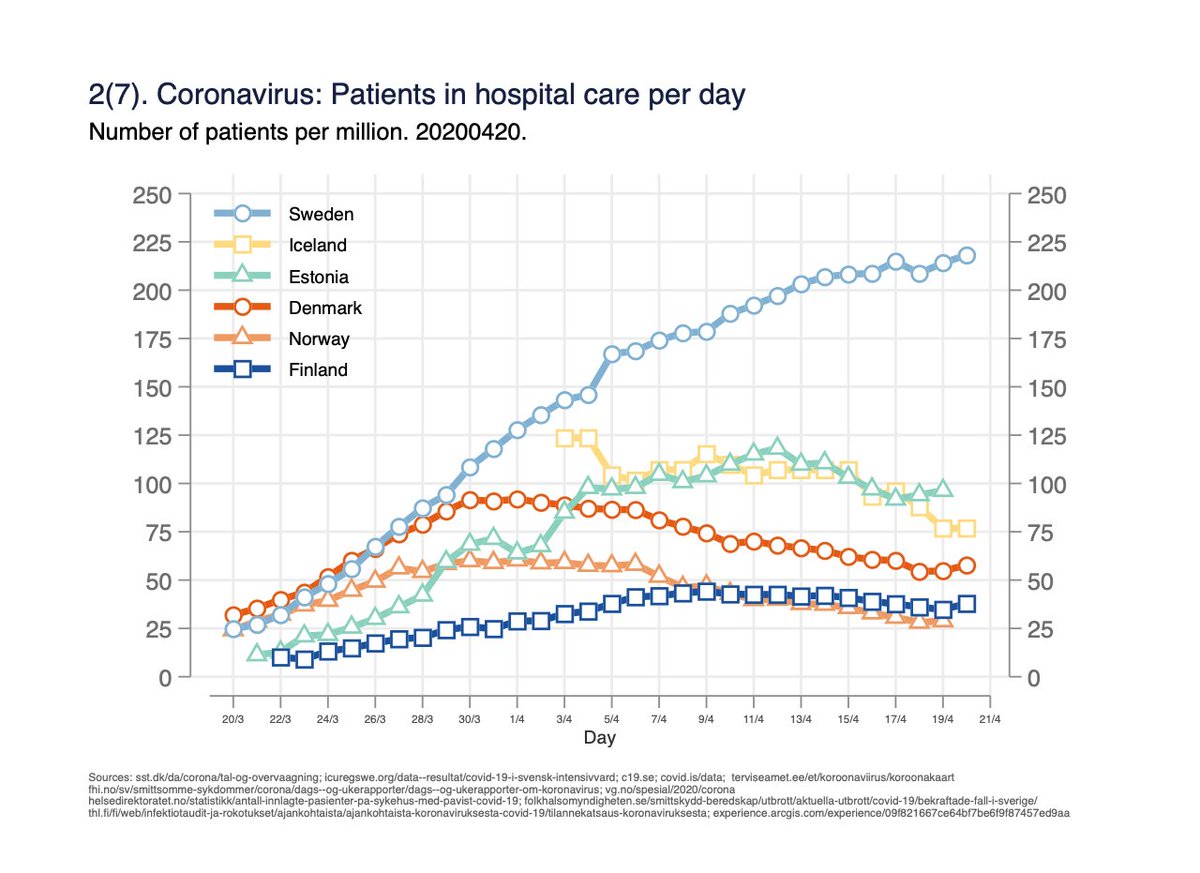
Fig 2. Number of persons in hospital care per day. Measures the burden on hospital capacity. 2/x
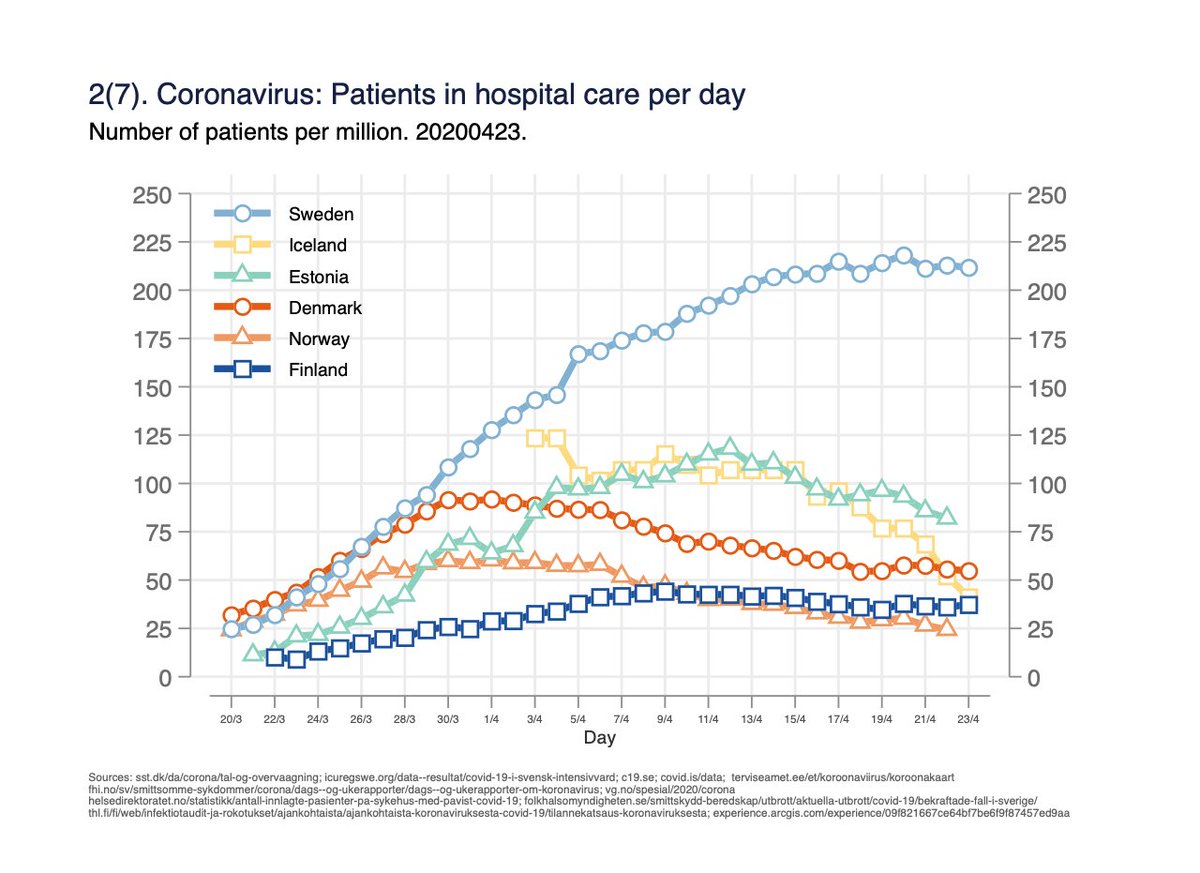
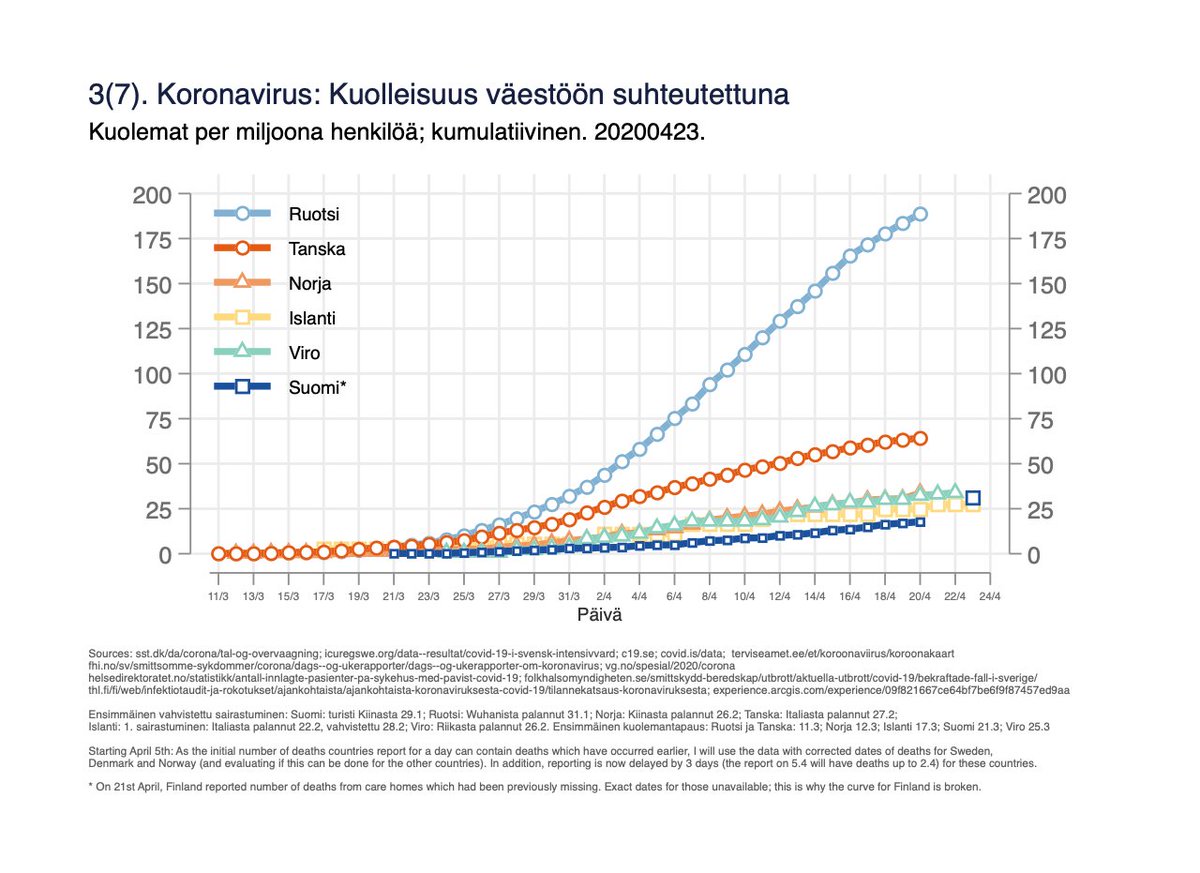
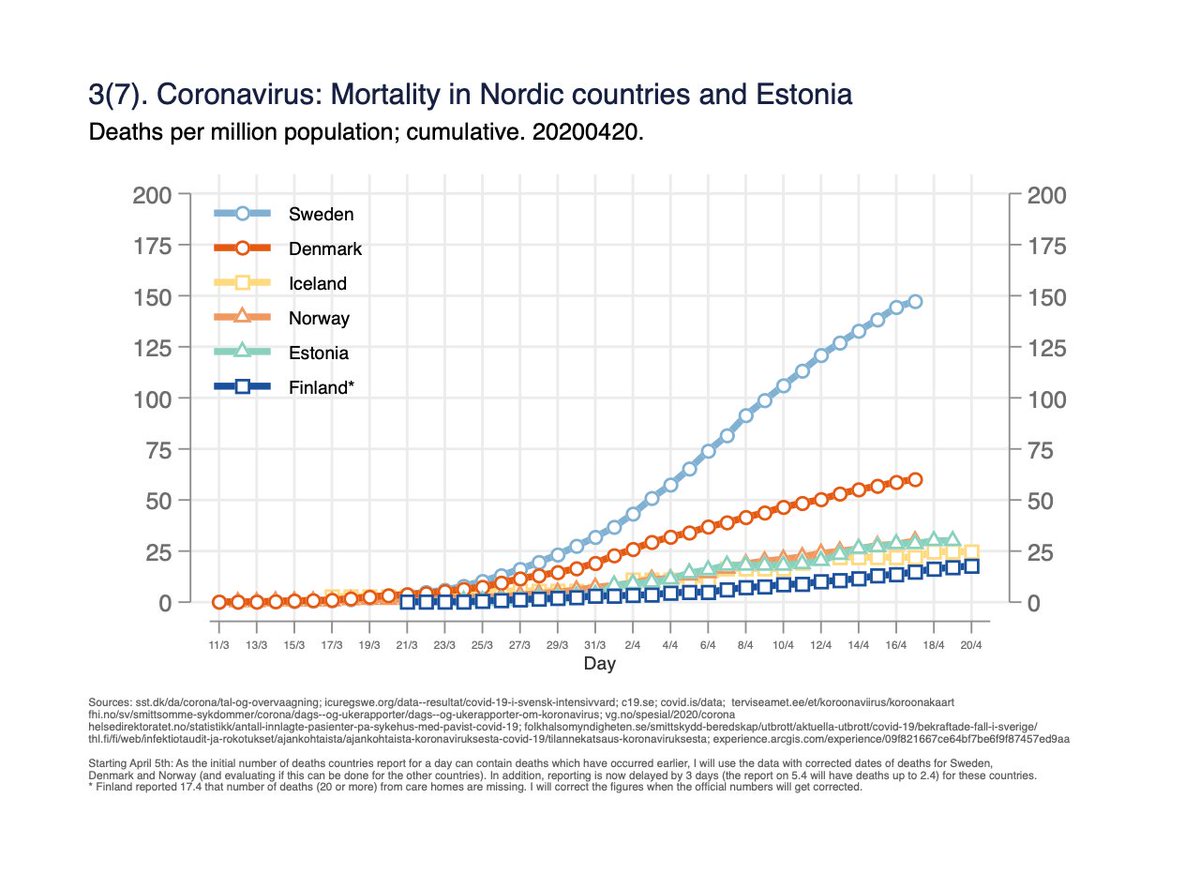
Fig 3. Mortality per million population. Finlands numbers corrected starting 21.4 as capital area Helsinki is reporting deaths at care homes which were previously missing (read below). 3/x

Fig 4. Mortality per million population on log-scale, by days since 2/million deaths in the country. Finlands numbers corrected starting 21.4 as capital area Helsinki is reporting deaths at care homes which were previously missing (read below). 4/x
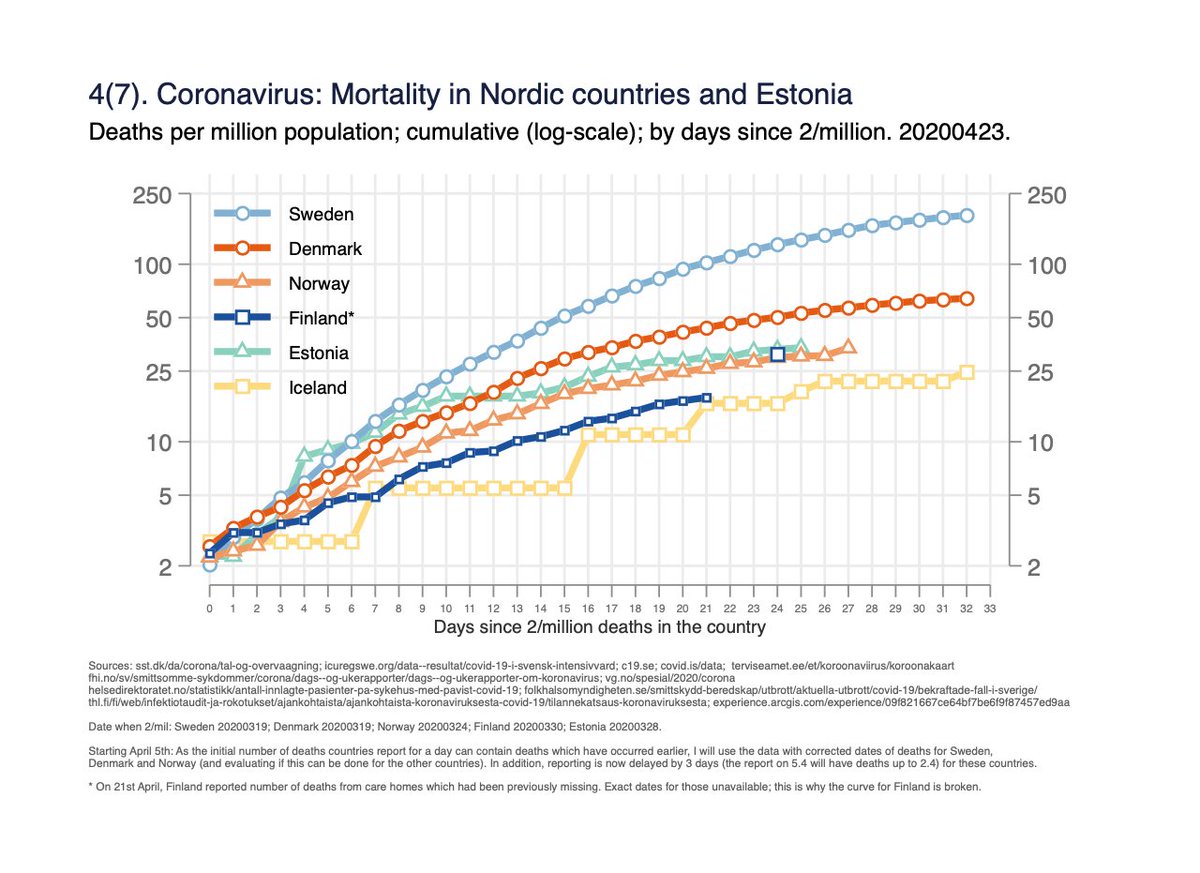
Fig 5. Absolute number of deaths by days since 10th death in the country. Finlands numbers corrected starting 21.4 as capital area Helsinki is reporting deaths at care homes which were previously missing (read below). 5/x

Geographical differences within Finland; might be of interest to other countries to understand the spread&trend between the capital area (Helsinki) vs rest.
Fig 6. Nr of persons in intensive care/day by the five “specialised medical care regions”: 6/x
Fig 6. Nr of persons in intensive care/day by the five “specialised medical care regions”: 6/x
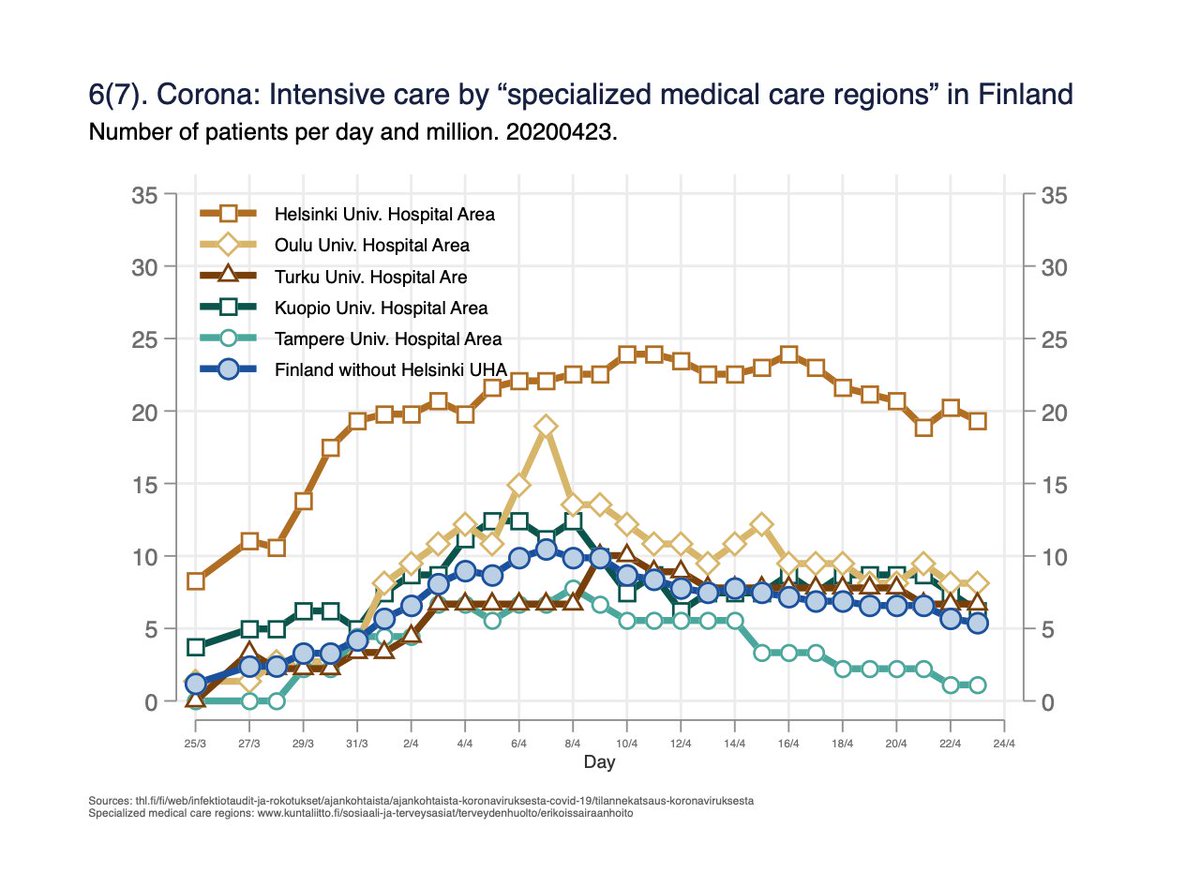
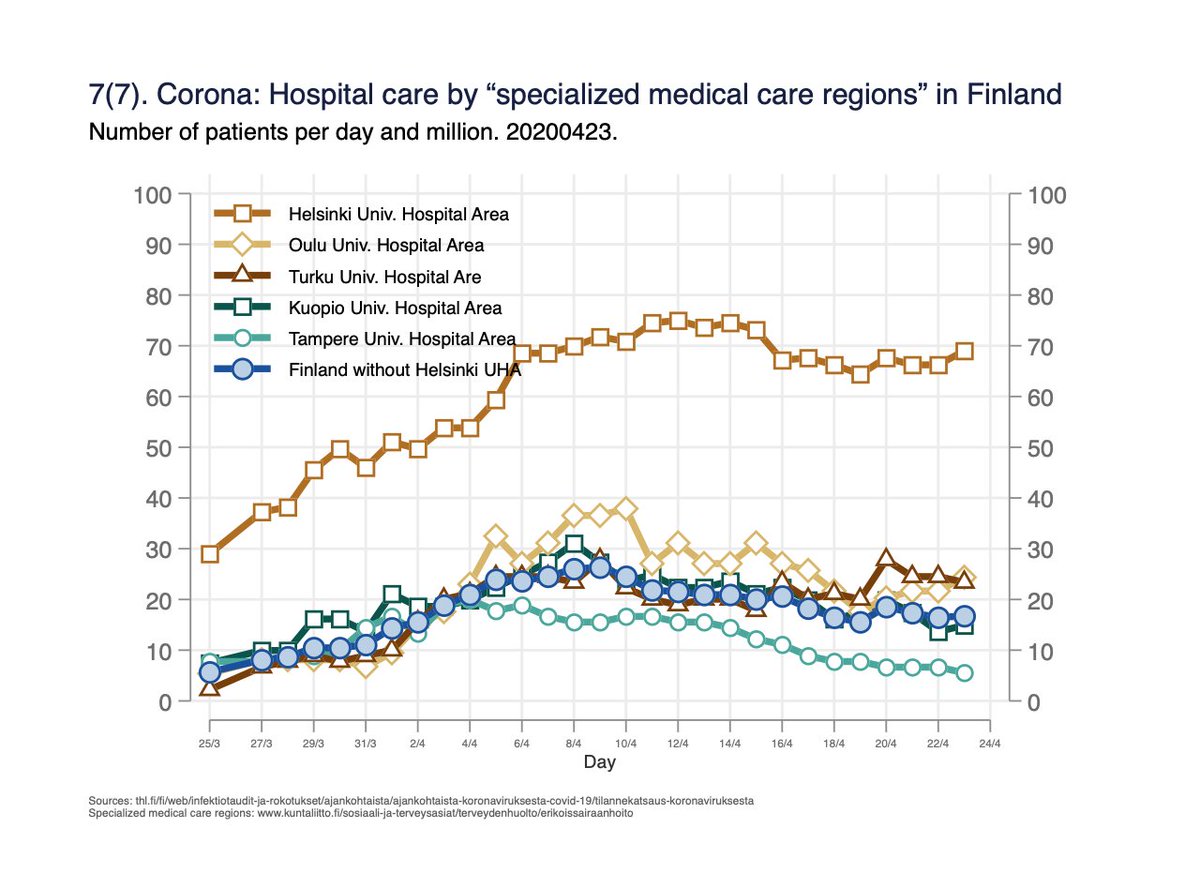
Fig 7. Within Finland: Number of persons in hospital care per day by the five “specialised medical care regions”: 7/x
Finlands mortality numbers are being corrected starting 21.4, as capital area Helsinki reported deaths at care homes which were previously missing.
I don’t have exact dates of deaths for the corrected; that is the reason I now only report the most recent number for Fin. 8/x
I don’t have exact dates of deaths for the corrected; that is the reason I now only report the most recent number for Fin. 8/x
Excess total mortality for different European countries is monitored in a nice way by the EuroMoMo project here; better way to compare countries. Now also age-specific data for different countries can be looked at: 9/x
euromomo.eu/graphs-and-map…
euromomo.eu/graphs-and-map…
The “new unique ICU patients/day” is still stable in Sweden (and might be slowly declining) but the “nr treated daily” in my Fig 2 remains at high level.
Figure “Nya unika coronapatienter på IVA i Sverige” in: 10/x
svt.se/datajournalist…
Figure “Nya unika coronapatienter på IVA i Sverige” in: 10/x
svt.se/datajournalist…
Different perspective; one month ago I made my 1st tweet on this topic; was asking if the mortality data could be used to estimate the phase of the epidemic in different countries: 11/11
The usuals: In addition to the possible differences in definitions/reporting, there could be many other explanations for the country differences: how the disease started to spread in populations (undetected cases); case-mix; distributions of demographics/comorbidities etc. 1/2
While comparisons about the levels between countries is difficult, I do think that these data give a rough idea about the *within country* changes, and differences in *when* changes happen in different countries. 2/2