1/ This week we may have seen the deployment of a new tool in the public health armamentarium, and it didn't get a lot of attention.
It's a good example of where something not that useful at 10,000 people becomes very interesting when deployed to millions
Tech people's "SCALE"
It's a good example of where something not that useful at 10,000 people becomes very interesting when deployed to millions
Tech people's "SCALE"
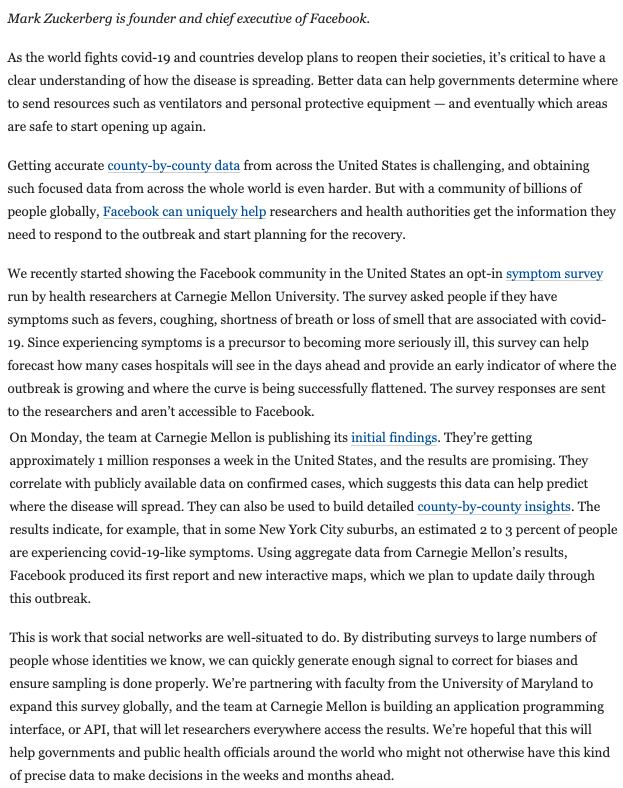
2/ Mark Zuckerberg wrote an oped in the @washingtonpost last week describing how FB was allowing CMU researchers to post an ad for an online symptom survey for free on the platform
FB would push sample weights to them but wouldn't be getting any data back
washingtonpost.com/opinions/2020/…
FB would push sample weights to them but wouldn't be getting any data back
washingtonpost.com/opinions/2020/…
3/ A LOT of skepticism in the comments and I expect to elicit similar reactions
*FB allows far right/Russian disinformation (civil unrest, manufactured "reopen" protests)
*FB wants your data to sell it
Regardless of my feelings about 👆I don't think this is an example of either
*FB allows far right/Russian disinformation (civil unrest, manufactured "reopen" protests)
*FB wants your data to sell it
Regardless of my feelings about 👆I don't think this is an example of either
4/ From an outbreak epidemiology perspective the reasoning is sound- moving upstream allows for earlier detection of a spike- and remember, with COVID, 2-3 days earlier action could literally cut the cases in half
This is my ugly slide from 2004
slideplayer.com/slide/5346203/
This is my ugly slide from 2004
slideplayer.com/slide/5346203/
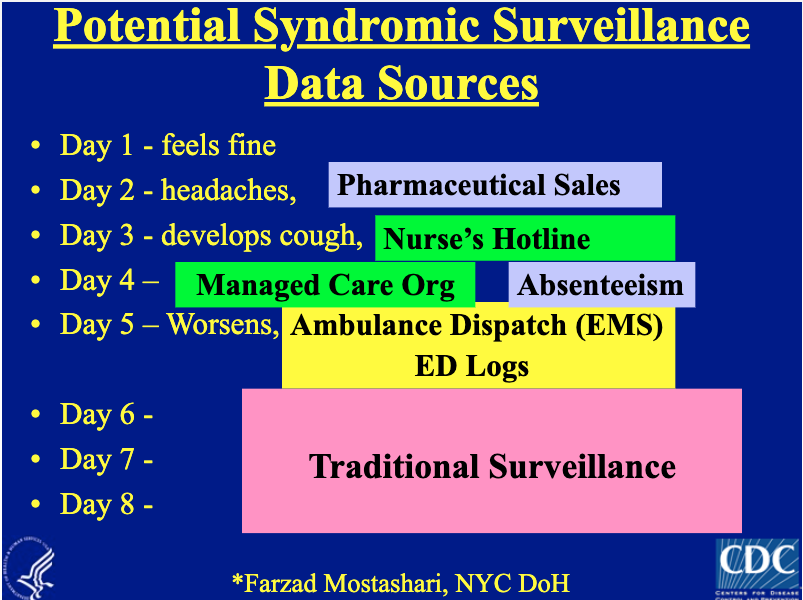
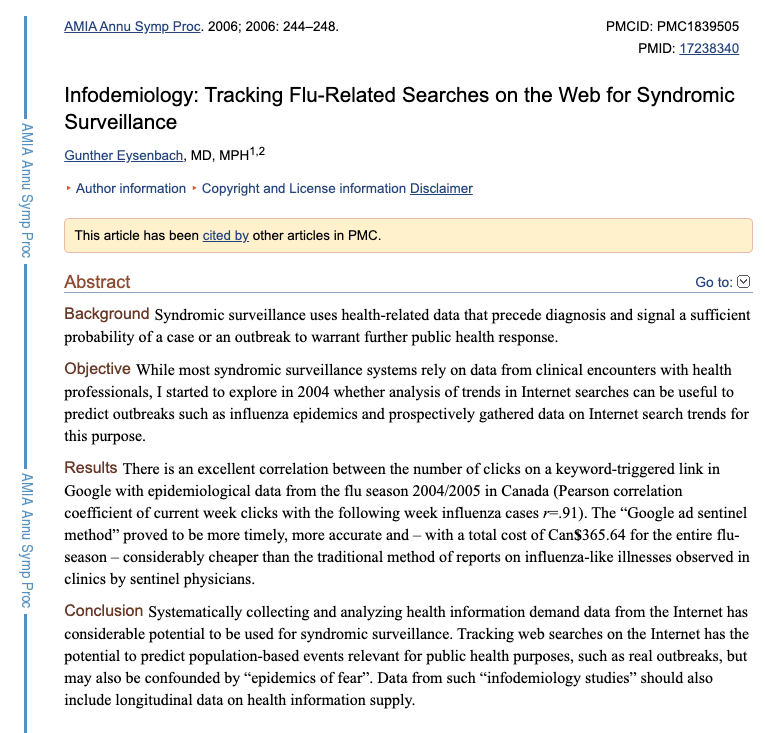
5/ And in the time of COVID, people are avoiding visits to doctors offices/emergency rooms "traditional syndromic surveillance" (wow-I can't believe it's so establishment now!) may not work as well- are we making reopening decisions on a faulty basis?
6/ To be clear, the idea of going upstream to people who gauge symptoms from people who are at home is nothing new
Google search trends (I thought I was first to do it but tbh, I thought it was a joke)
Self-report apps @johnbrownstein @FluNearYou
Thermometers @kinsa
Google ads
Google search trends (I thought I was first to do it but tbh, I thought it was a joke)
Self-report apps @johnbrownstein @FluNearYou
Thermometers @kinsa
Google ads
7/ So I had low expectations when I was asked for my opinion about likely utility of FB->CMU survey
Until they said: "we're going to do a million surveys a week"
I involuntarily laughed out loud
With that sort of sample size, you *could* see changes over time, in small areas
Until they said: "we're going to do a million surveys a week"
I involuntarily laughed out loud
With that sort of sample size, you *could* see changes over time, in small areas
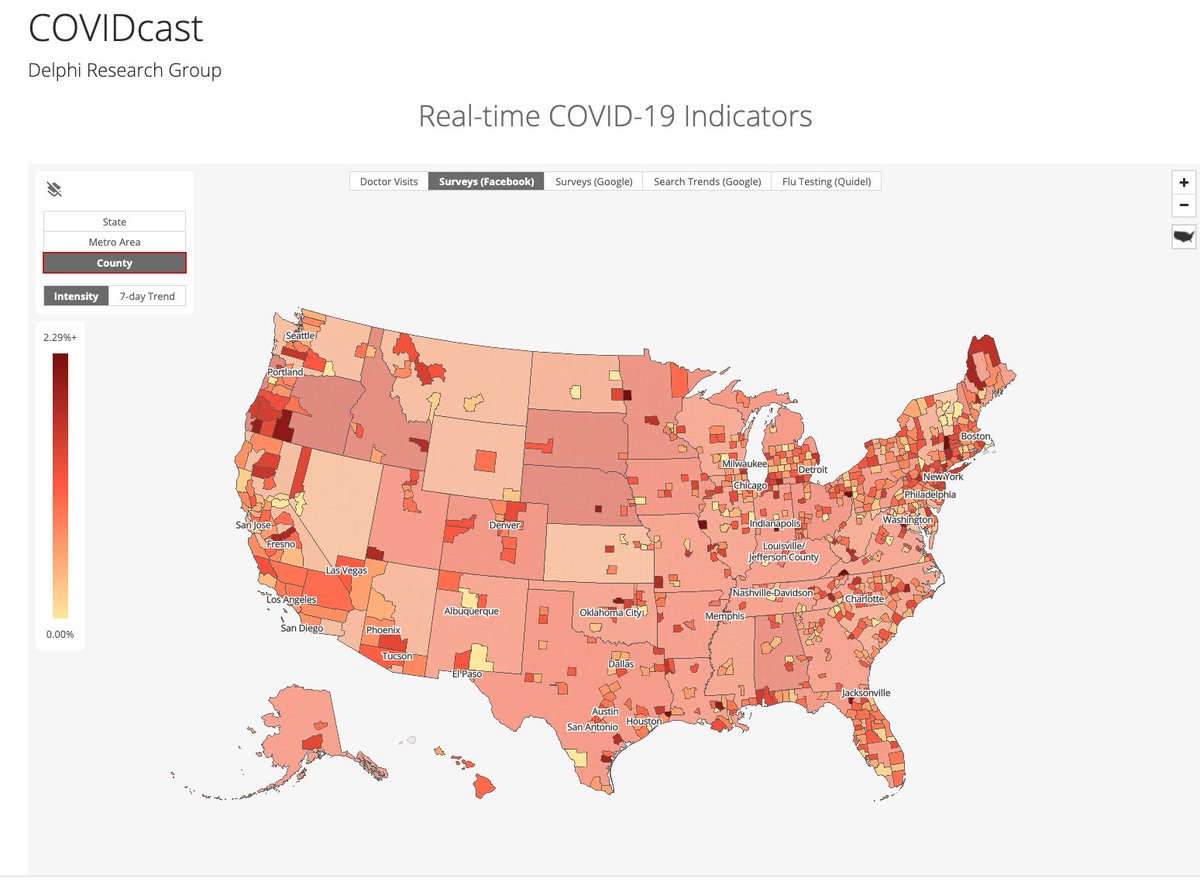
8/ So what does it look like?
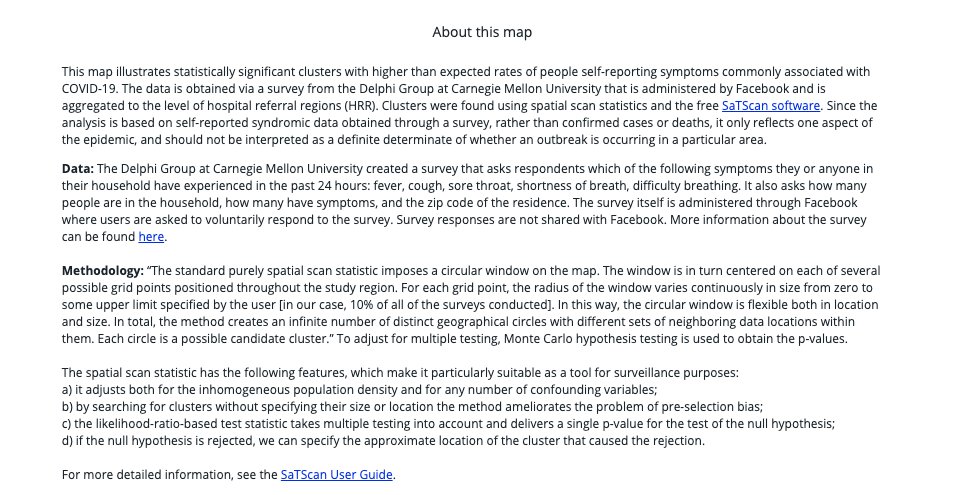
Well, CMU has put out some maps with the data
and you can toggle through different days on facebook's presentation of it covid-survey.dataforgood.fb.com (they only get aggregated data back from CMU)
A little hard to know what to make of it, kinda patchy
Well, CMU has put out some maps with the data
and you can toggle through different days on facebook's presentation of it covid-survey.dataforgood.fb.com (they only get aggregated data back from CMU)
A little hard to know what to make of it, kinda patchy
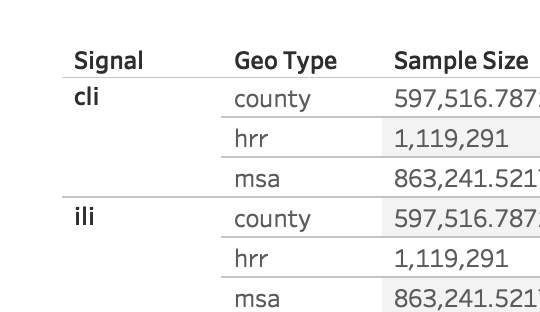
9/ To their huge credit CMU/FB created API access to the aggregated, weighted data at various levels of geography - for anyone.
I love how open different communities have been with data access during COVID 💯
so we called an old friend and took a look
cmu-delphi.github.io/delphi-epidata…
I love how open different communities have been with data access during COVID 💯
so we called an old friend and took a look
cmu-delphi.github.io/delphi-epidata…
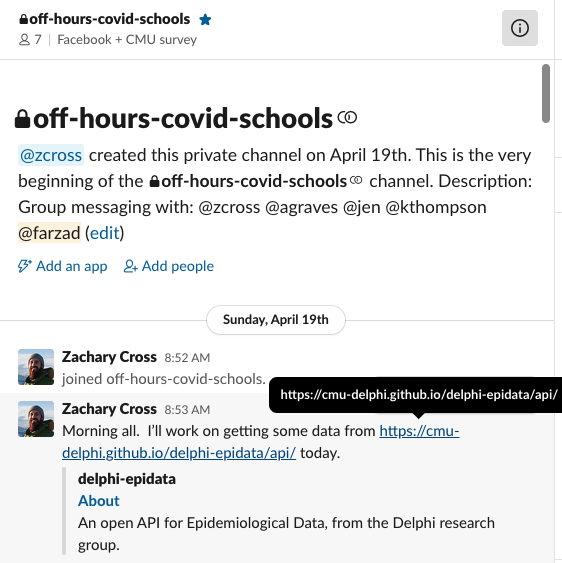
10/ This project started less than a week ago- was literally called "off-hours-covid-schools" because it was members of @AledadeACO amazing data and analytics teams burning midnight oil to maybe help the common weal
Thanks team
Thanks team
11/ We also knew that we needed real statistical rigor on evaluating whether apparent clusters could be due to chance alone
I called an old friend, Martin Kulldorff who's the smartest statistician I know for spatial and temporal cluster detection methods
drugepi.org/faculty-staff-…
I called an old friend, Martin Kulldorff who's the smartest statistician I know for spatial and temporal cluster detection methods
drugepi.org/faculty-staff-…
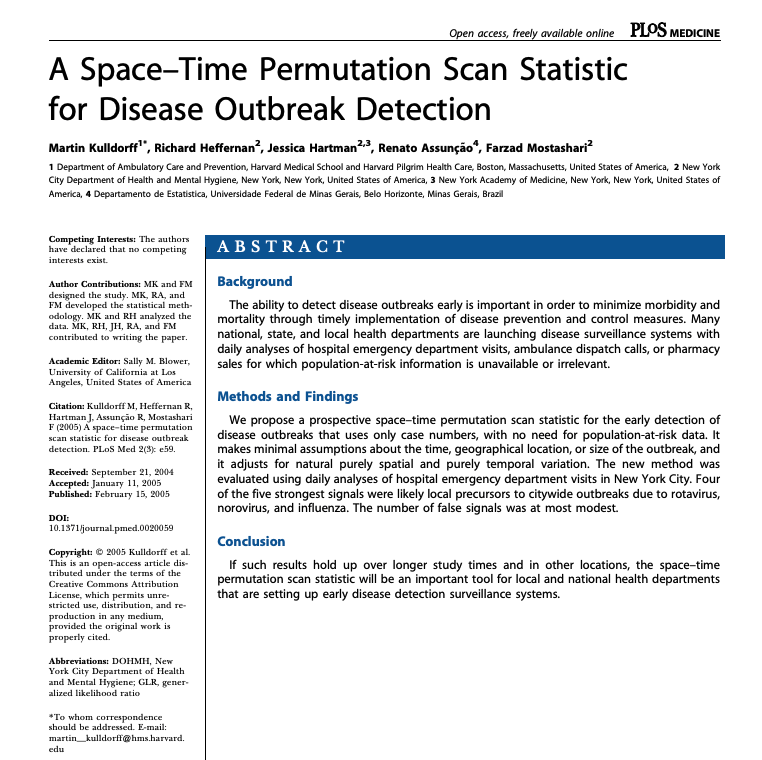
12/ He's spent literally 20 years developing, updating openly available software for doing spatial and spatial-temporal clustering
I was proud to have been able to help support one small part of that through a grant from @polsiewski @SloanFoundation
satscan.org
I was proud to have been able to help support one small part of that through a grant from @polsiewski @SloanFoundation
satscan.org
13/ The advantage of this methodology is that it accounts for the "Texas Sharpshooter fallacy"-
By chance alone you would always expect to find some clustering. This methodology ranks (MonteCarlo) observed clusters against those created by chance alone
bayesianspectacles.org/origin-of-the-…
By chance alone you would always expect to find some clustering. This methodology ranks (MonteCarlo) observed clusters against those created by chance alone
bayesianspectacles.org/origin-of-the-…
14/ You can read more about the methods, but key advantages of spatial scan is that it can aggregate adjoining areas to increase signal strength, and will discount a patchwork (with high next to low)
other methods briefly described here:
other methods briefly described here:
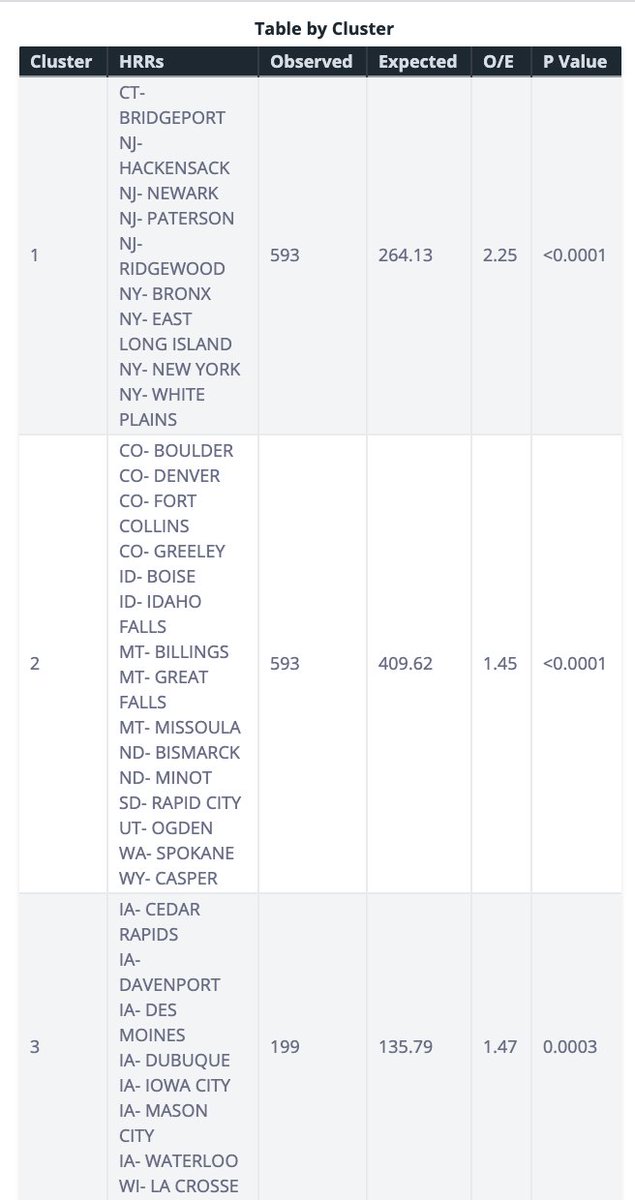
15/ So here's the map!
the top symptom cluster in around NYC (check)
593 observed cases of "covid-like" symptoms
/264 expected (O/E 2.25)
#2: Large frontier state cluster (CO-ID-MT-ND-SD-UT-western WA)
#3- Iowa
#4-centered on IN/OH
#5- Oregon
covidmap.aledade.com/survey-symptom…
the top symptom cluster in around NYC (check)
593 observed cases of "covid-like" symptoms
/264 expected (O/E 2.25)
#2: Large frontier state cluster (CO-ID-MT-ND-SD-UT-western WA)
#3- Iowa
#4-centered on IN/OH
#5- Oregon
covidmap.aledade.com/survey-symptom…
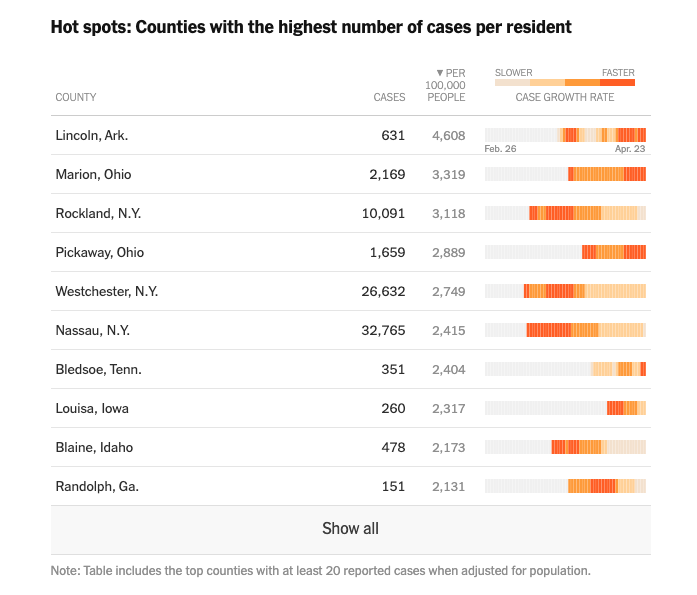
16/ I think this is consistent enough with what we already know based on lab-confirmed cases to be credible- and different enough to add some potential value
Over past 10 days, NY/CT/NJ would make sense as the hottest cluster
IA positivity rate climbing
Over past 10 days, NY/CT/NJ would make sense as the hottest cluster
IA positivity rate climbing
17/ A number of recent hotspots (including communities around prison outbreaks) in Ohio, Iowa, Idaho are in these symptom clusters (although several aren't)
18/ So what's next?
First, it will be important for these signals to be validated
That was one of the big knocks we public health types had about Google Flu Trends- how are these to be investigated at the local level? You need shoe-leather epidemiology
nature.com/articles/npre.…
First, it will be important for these signals to be validated
That was one of the big knocks we public health types had about Google Flu Trends- how are these to be investigated at the local level? You need shoe-leather epidemiology
nature.com/articles/npre.…
19/ One intriguing way to validate these signals might be for CMU to offer respondents who have worrisome symptoms the option of being contacted by their local public health department, to be COVID-tested
c/f suicidal ideation on health surveys->suicide prevention hotline number
c/f suicidal ideation on health surveys->suicide prevention hotline number
20/ Next, it may just be that in some part of the country people generally complain more (or less) about cough/ sore throat than others.
It will be important to look for CHANGES from this baseline, to see if there are emergent hotspots/ cooling spots.
(we plan to do that soon)
It will be important to look for CHANGES from this baseline, to see if there are emergent hotspots/ cooling spots.
(we plan to do that soon)
21/ Change over time could also account for response/consent bias (it's more likely that people with symptoms will click on the ad)
This has been my main concern (right after test specificity) with the "Stanford serosurvey"
That propensity could be different in different areas.
This has been my main concern (right after test specificity) with the "Stanford serosurvey"
That propensity could be different in different areas.
22/ To have more timeliness & accuracy in looking at changes over time in smaller areas (even with a million surveys a week), will need to "zoom in" on areas with worrisome trends, or where other data raises concern of outbreak, and gather more sample ("adaptive sampling" FTW)
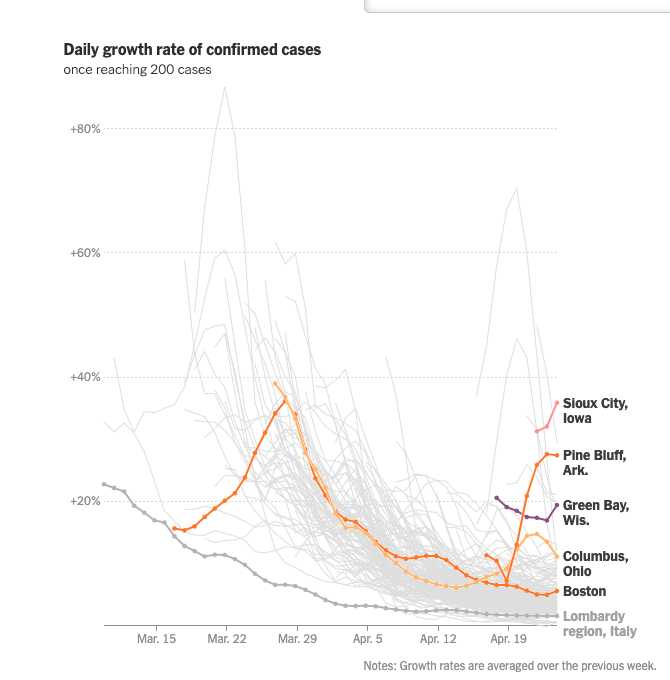
23/ And ultimately the proof will be in the pudding.
will we see a rise in cases in a week or two in Wyoming and Montana, in Iowa, and Ohio and Indiana, in Salem and Eugene Oregon?
Someone needs to put all these different data sources next to each other for each state (not it!)
will we see a rise in cases in a week or two in Wyoming and Montana, in Iowa, and Ohio and Indiana, in Salem and Eugene Oregon?
Someone needs to put all these different data sources next to each other for each state (not it!)
24/ And even if this symptom surveillance works now, when COVID and flu season coincide it will "actually be even more difficult than the one we just went through" (to coin a phrase)
That's true BTW also for Sentinel ILINet and ED syndromic
HT Seattle/KC Health Officer @DocJeffD
That's true BTW also for Sentinel ILINet and ED syndromic
HT Seattle/KC Health Officer @DocJeffD
25/ We have a few months to figure out how to fine-tune the signal for COVID symptoms away from flu noise:
*control for level of flu viral isolates
*look for specific symptoms (smell/taste changes)
*age-specific patterns (middle-aged>>kids)
*other?
Or just test with abandon
*control for level of flu viral isolates
*look for specific symptoms (smell/taste changes)
*age-specific patterns (middle-aged>>kids)
*other?
Or just test with abandon
26/ For those of you who had trouble loading the map (Chrome on Mobile?), and to preserve this snapshot for posterity, here are the images for data run through 4/18